Tree Map
Overview
Visualize data in a tree map to compare different entities. Each entity is portrayed in a separate block of the tree map with a different color for an easier analysis at a single glance. The size of a block is determined by its value field.
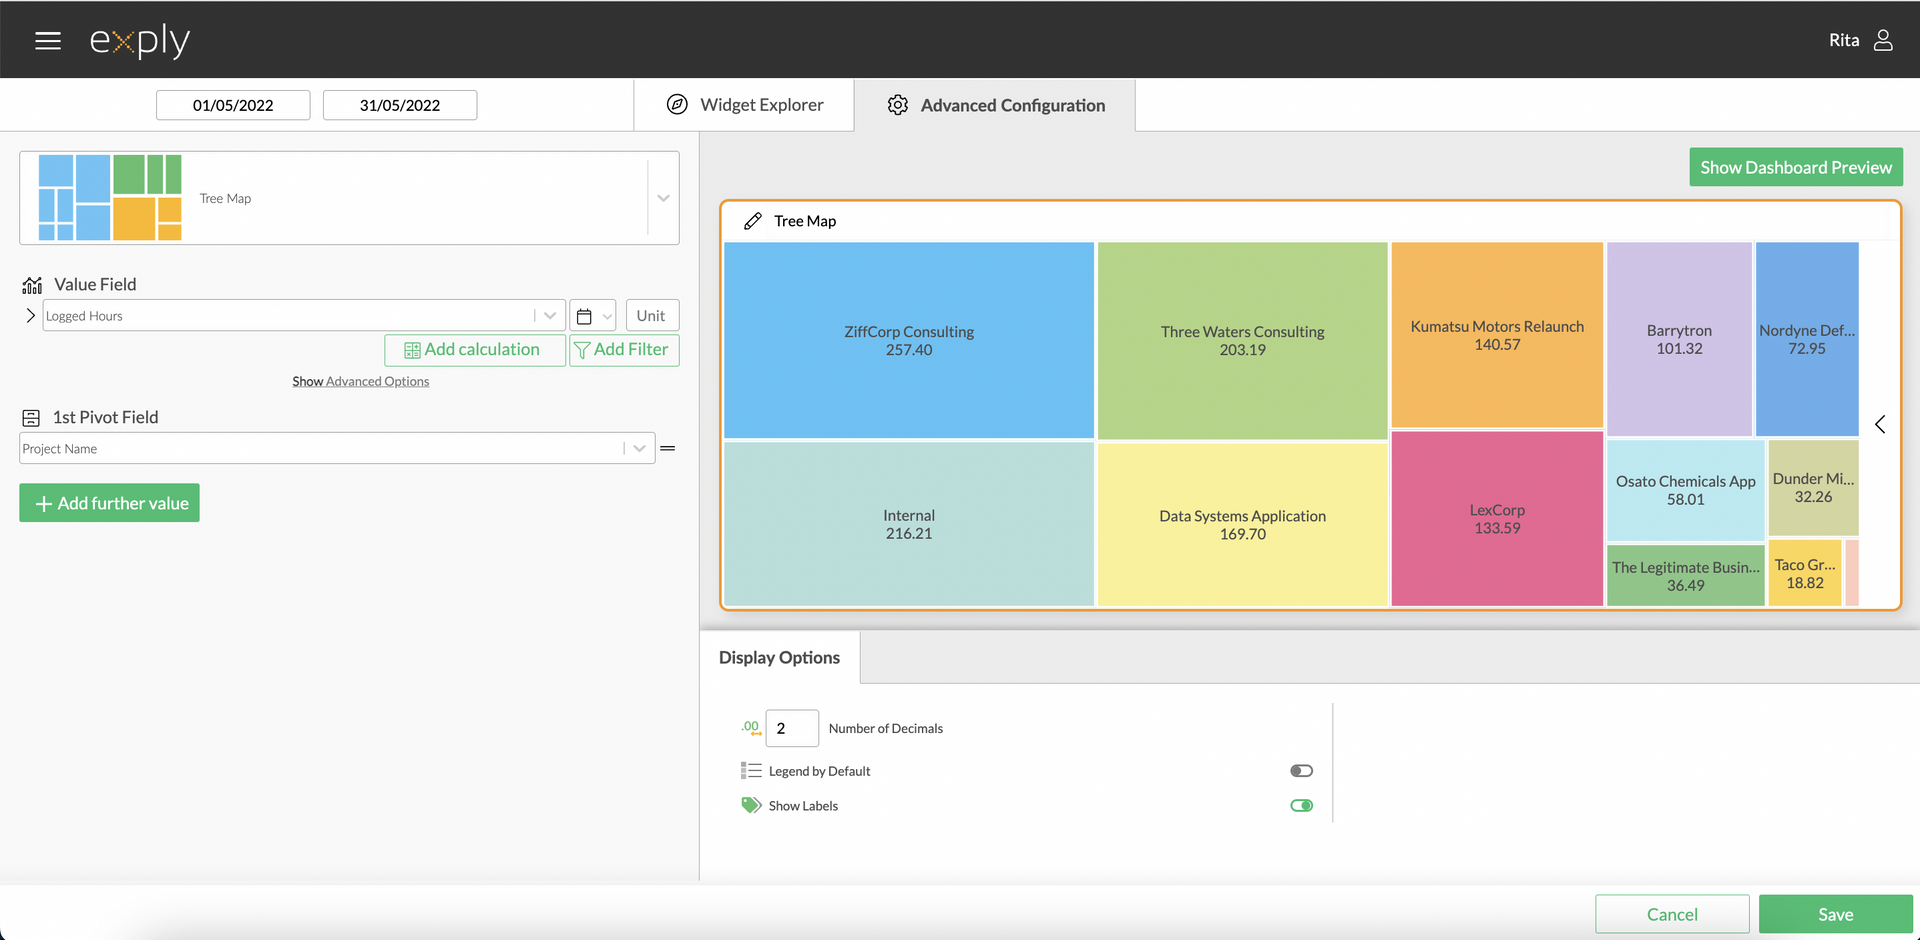
Tree Map Advanced Configuration Screen
Options
Every widget comes with a different set of options. All available options are described in the following passage.
Data Options
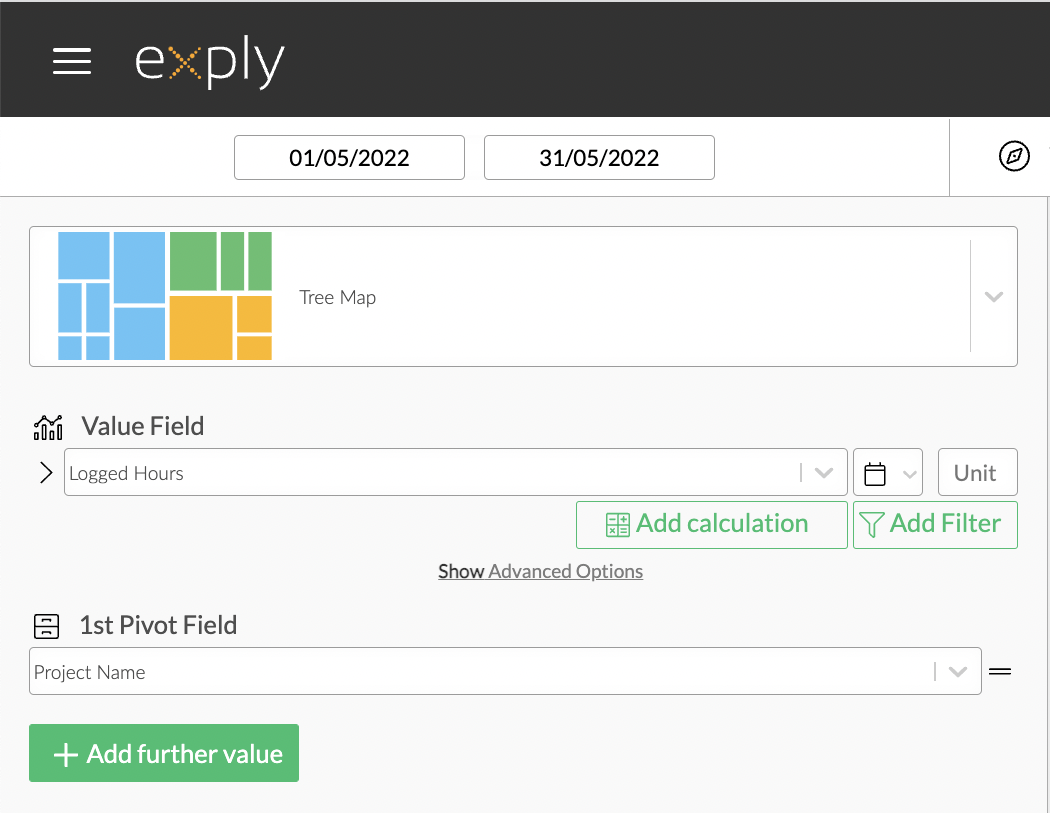
Tree Map Data Options Overview
Values
From top to bottom, the left side of a widget always starts with the value.
You can add a calculation (for more information, check out the Calculations section of this guide) and a custom label to your value field.
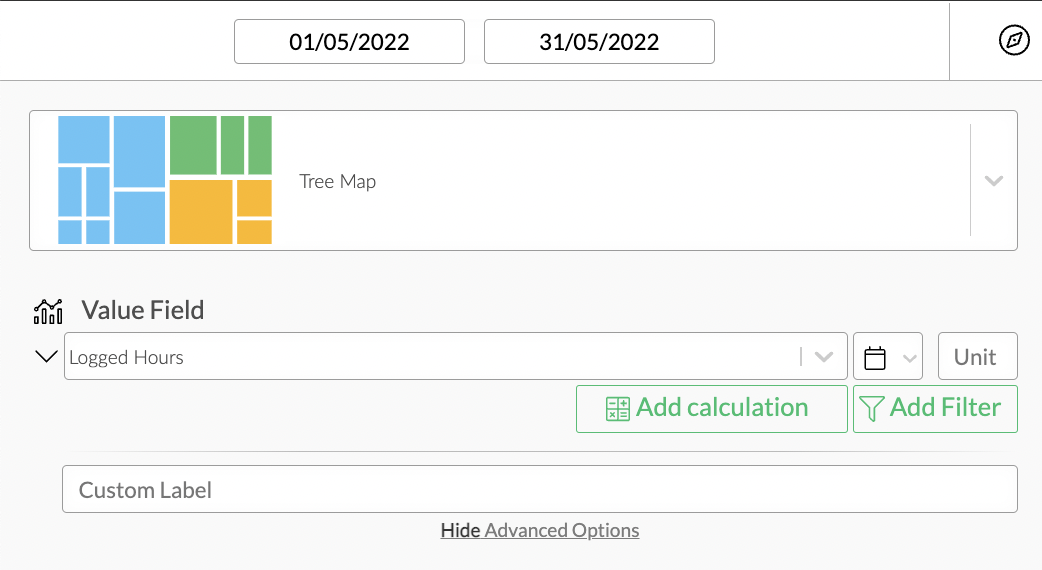
Tree Map Value Configuration
Value Filters
As in every other chart, you can apply value filters to your chosen value in the tree map. Find out more about how to configure them in the Filters section!
Pivot Fields
The first pivot field sets the category of your value.
The second Pivot Field option allows you to pivot your data by a second dimension. Here is an example:
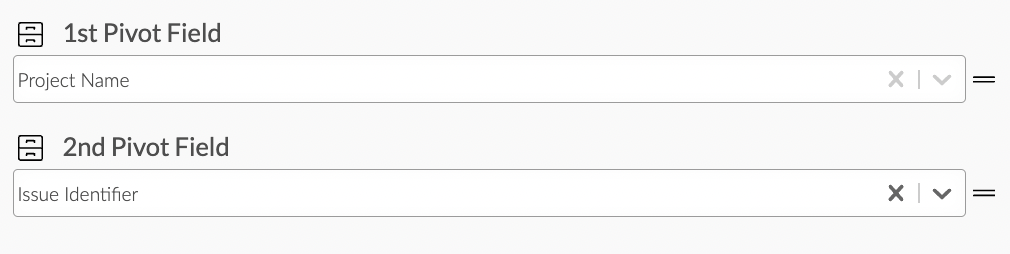
Tree Map Pivot Field Configuration
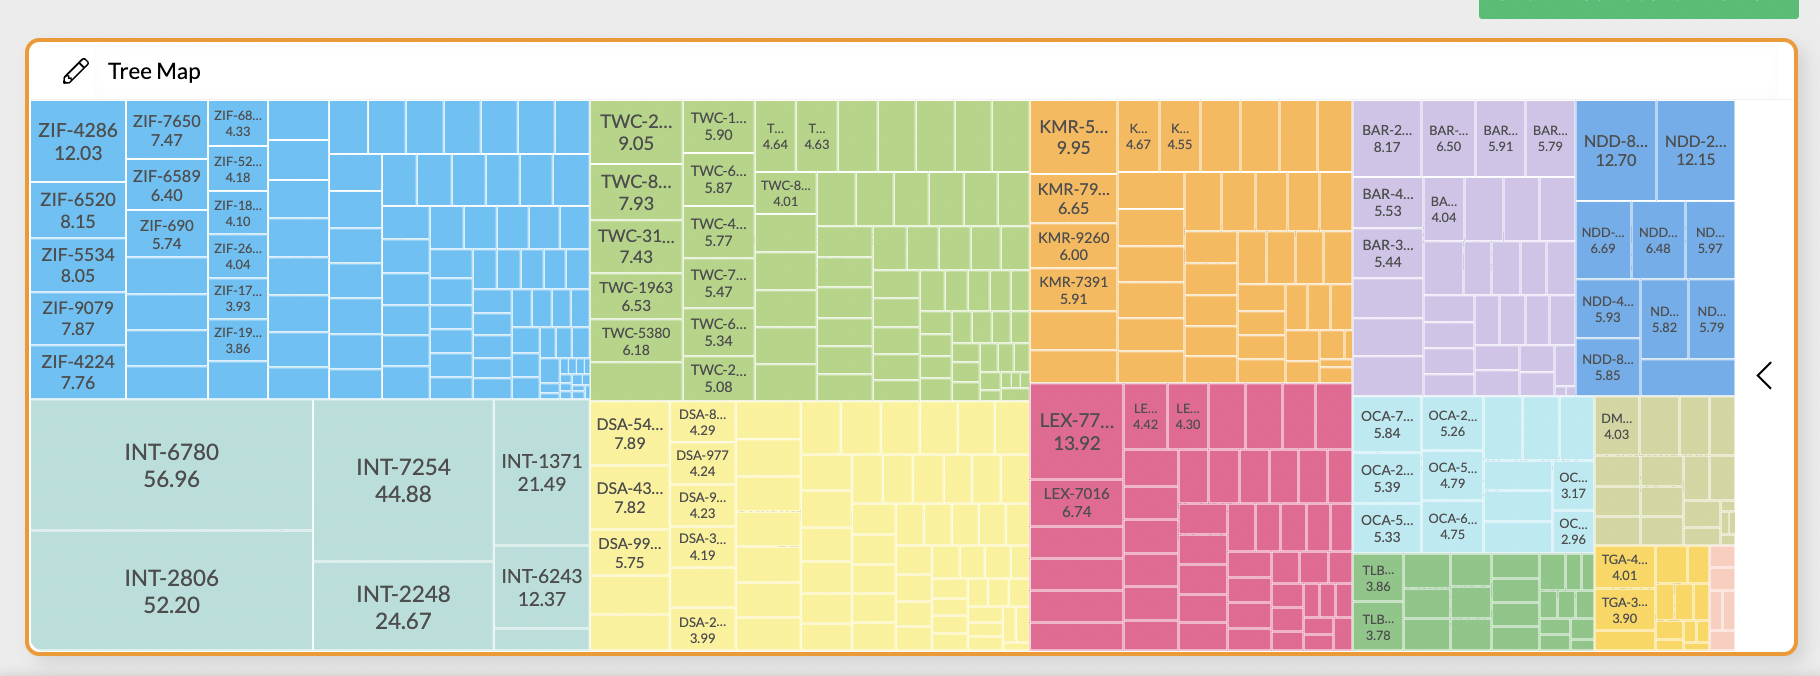
Tree Map Pivot Field Configuration Example
Here you can see an example of a tree map showing logged hours per project:
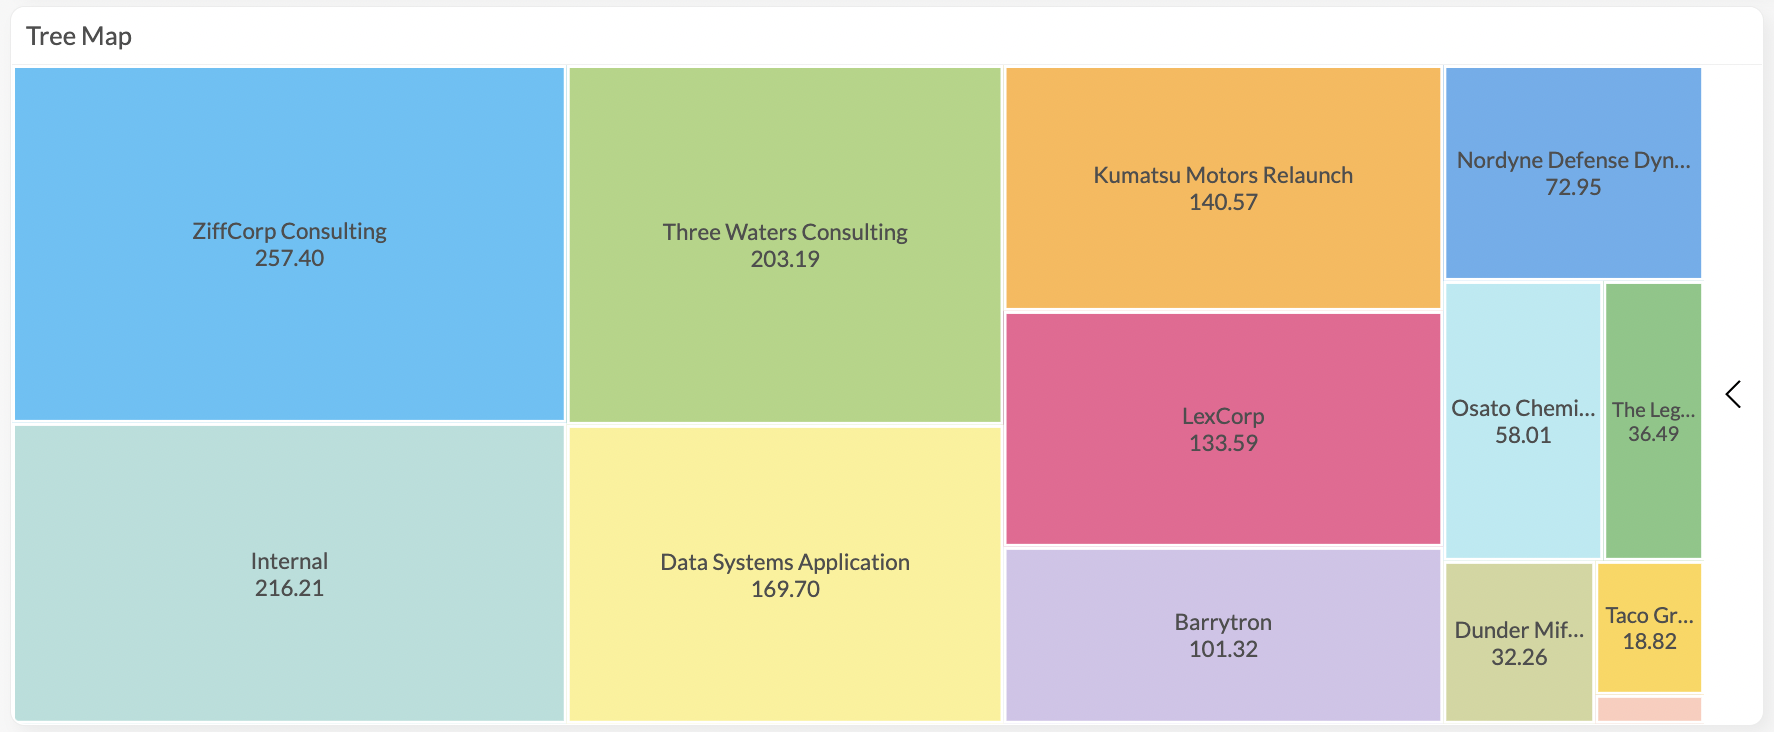
Tree Map Example
Display Options
Display options are used to modify the appearance of a widget. The following options are available:
You can limit the number of decimals of the values visible in the tree map blocks. In addition, you can enable a legend, for example if the blocks are too small to decipher the category titles without hovering over them with the mouse or if you want to disable the category labels inside the blocks.
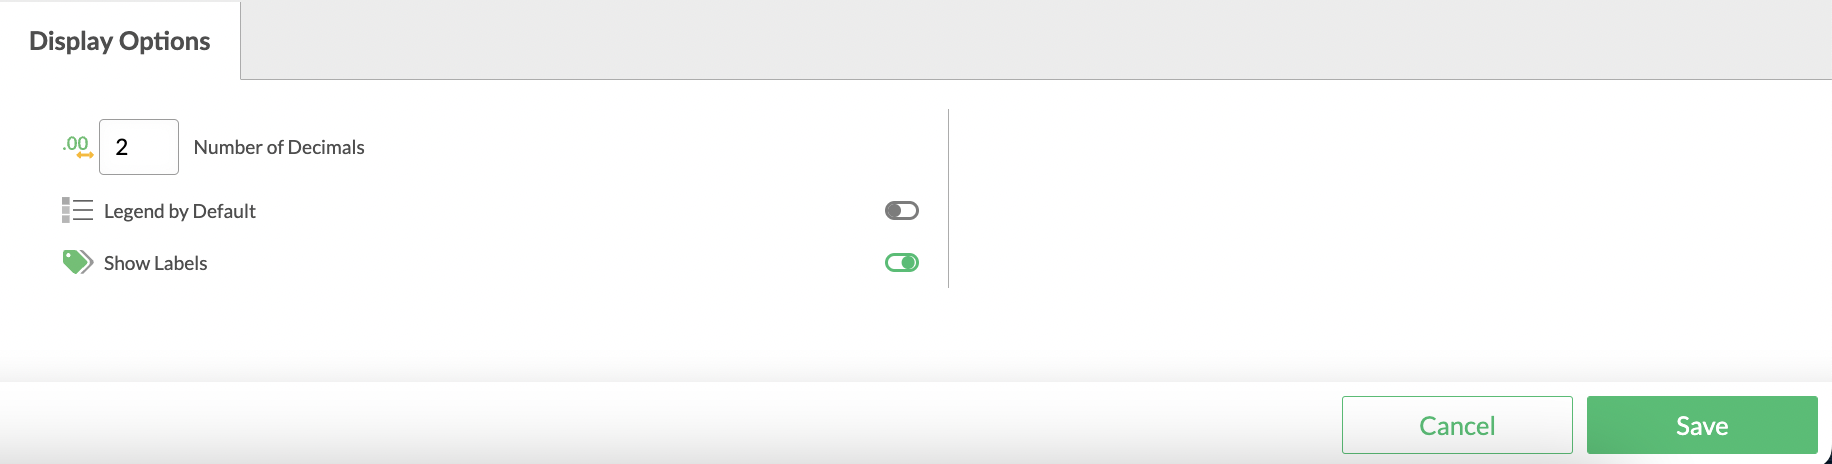
Tree Map Display Options