Video Tutorials
We've created a few video tutorials to give you a quick insight into how common tasks can be performed in Exply. If you have any questions regarding these videos or if you aren't sure how to perform a certain task in Exply, please reach out to us :)
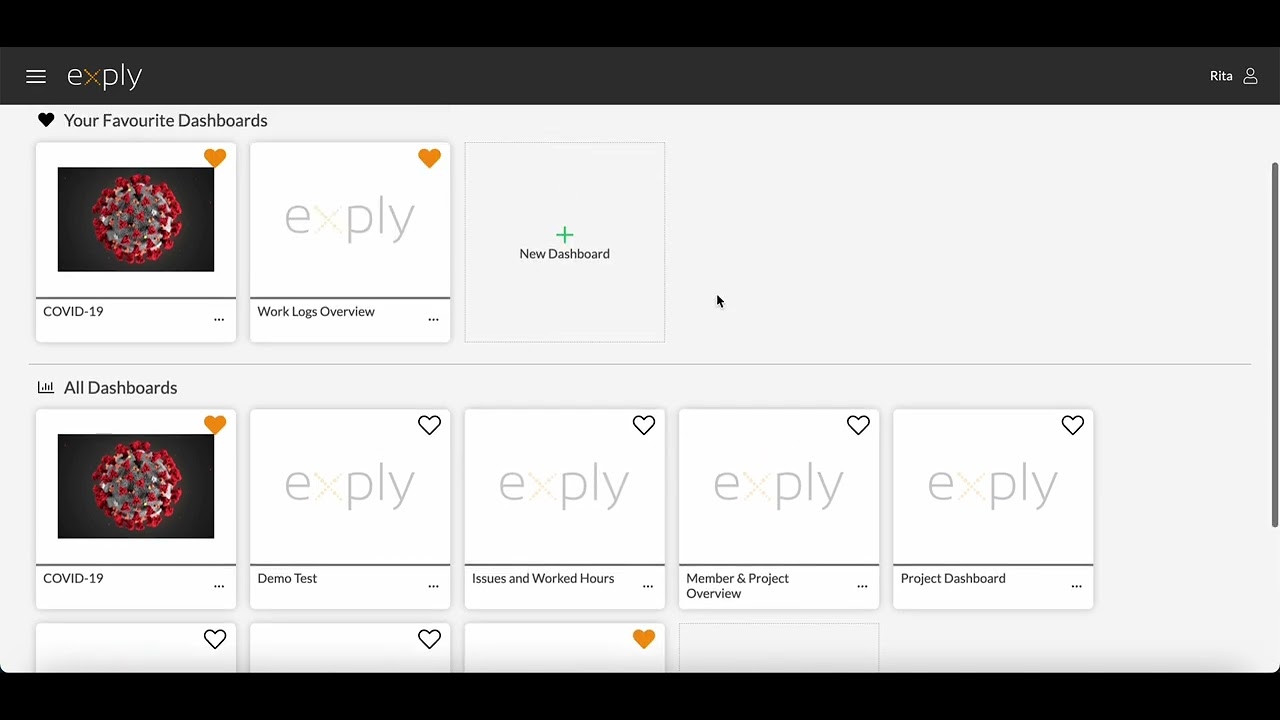
Dashboard Overview Options
![](https://img.youtube.com/vi/Ttp-PnOzBZQ/maxresdefault.jpg)
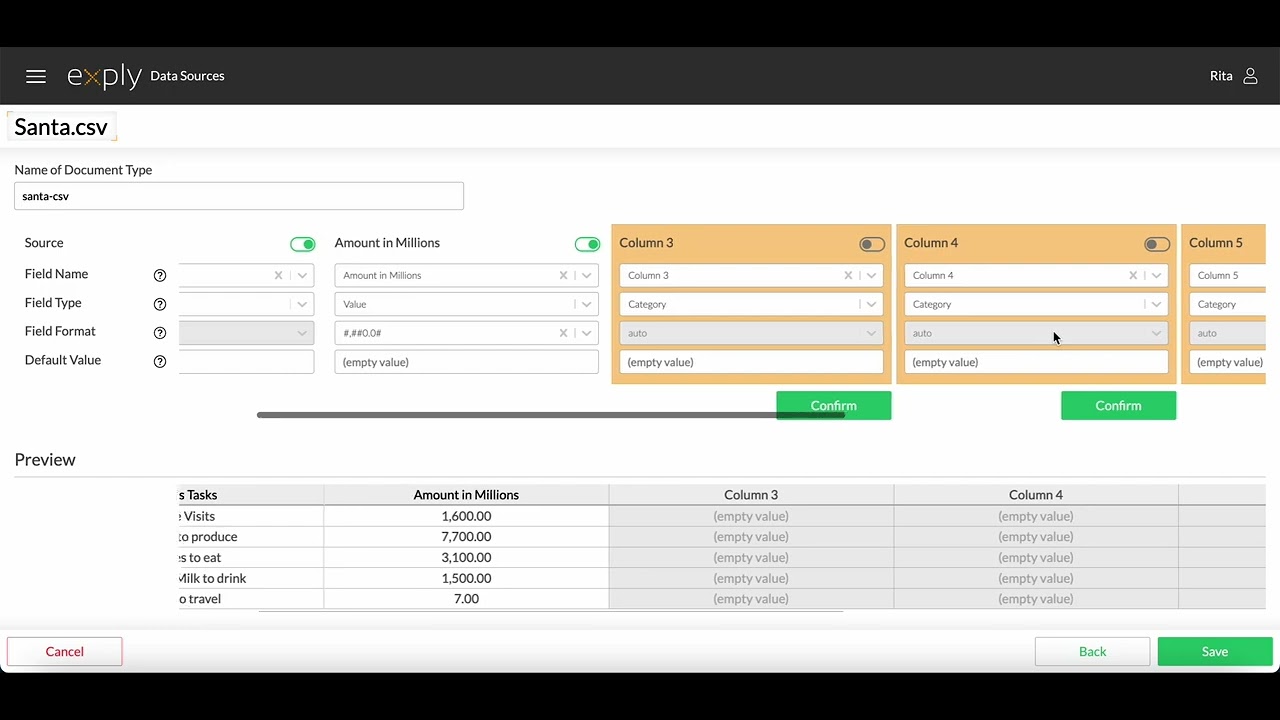
Data Import Example (CSV File)
![](https://img.youtube.com/vi/7LvePMMMbKQ/maxresdefault.jpg)
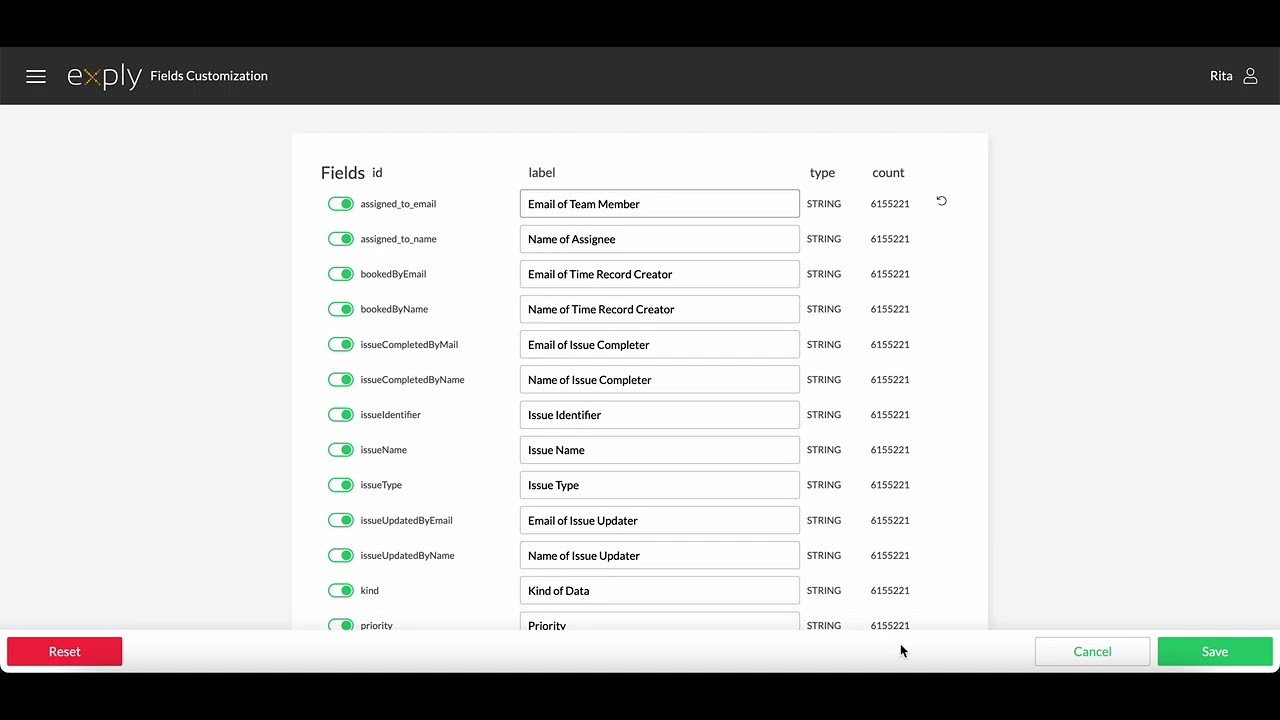
Field Customisation (And How To Revert Previous Changes )
![](https://img.youtube.com/vi/1NkoWr6zI0Y/maxresdefault.jpg)
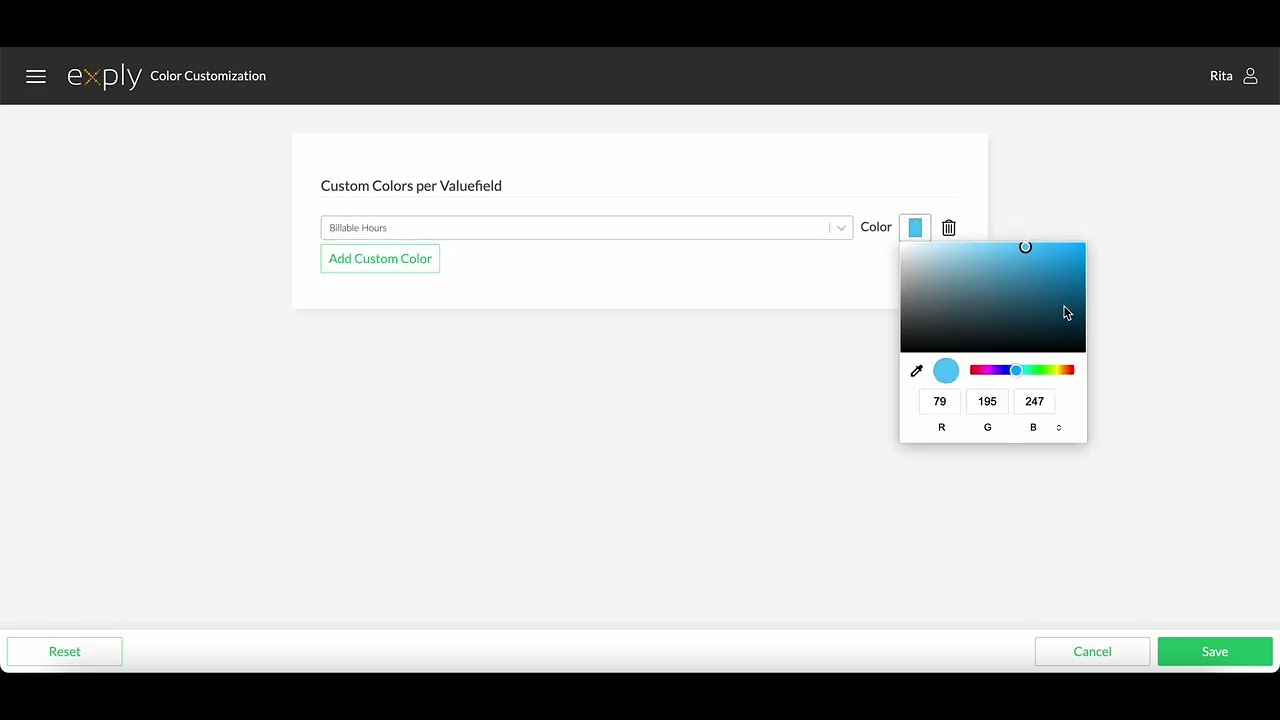
Set Custom Colors For Value Fields
![](https://img.youtube.com/vi/S6Fr2HK94Cs/maxresdefault.jpg)
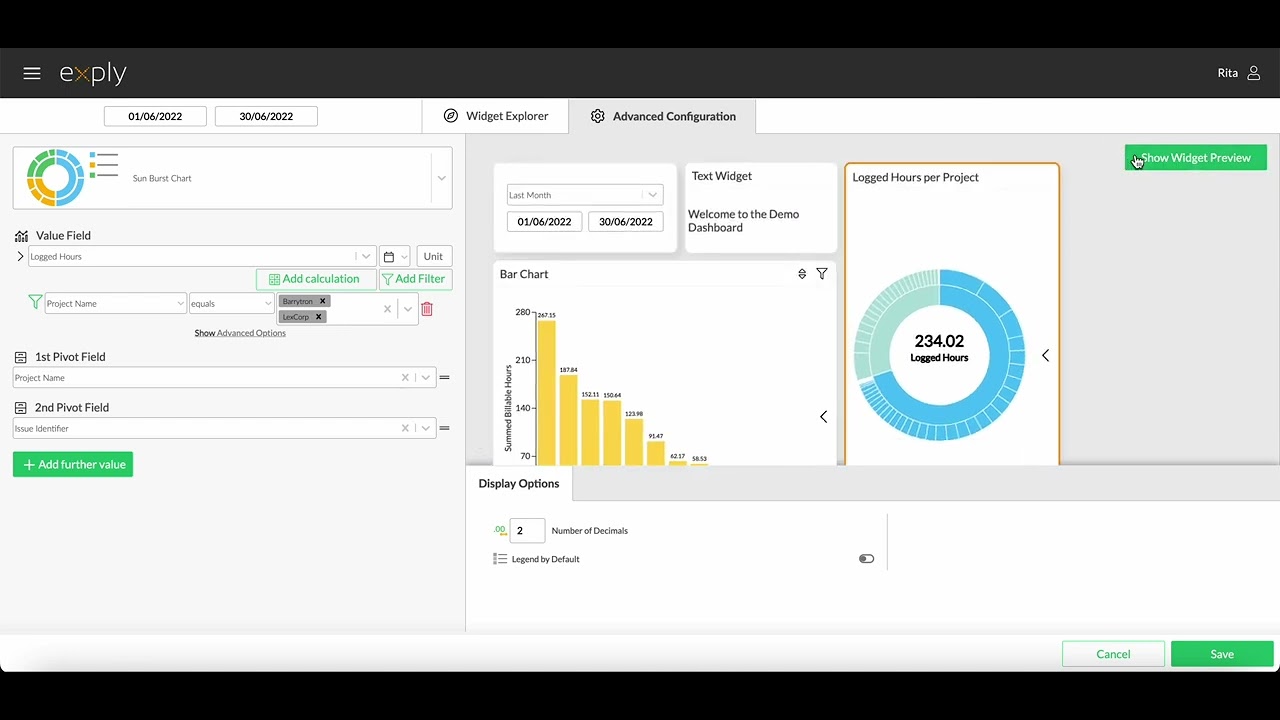
Change Widget Title and Preview Dashboard
![](https://img.youtube.com/vi/x7tt_7zCHfU/maxresdefault.jpg)
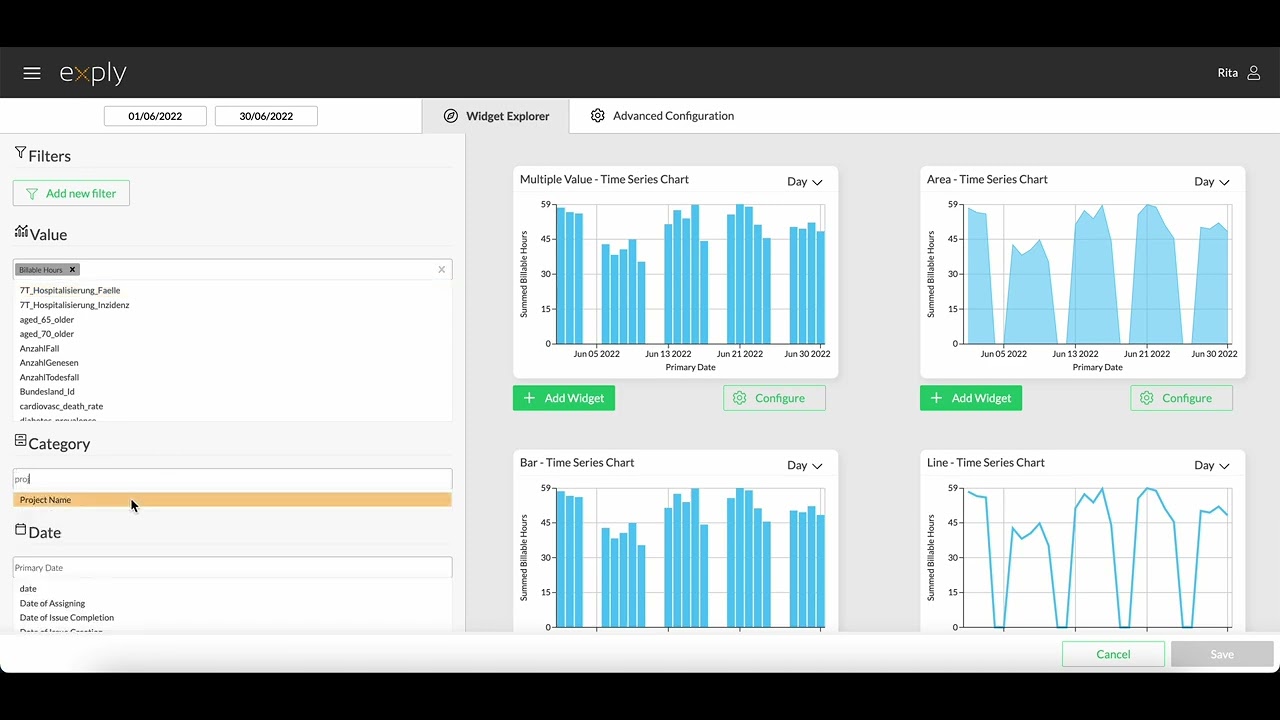
Quick Filter Creation and Drag'n'Drop on a Dashboard
![](https://img.youtube.com/vi/ugifWjlfVVE/maxresdefault.jpg)
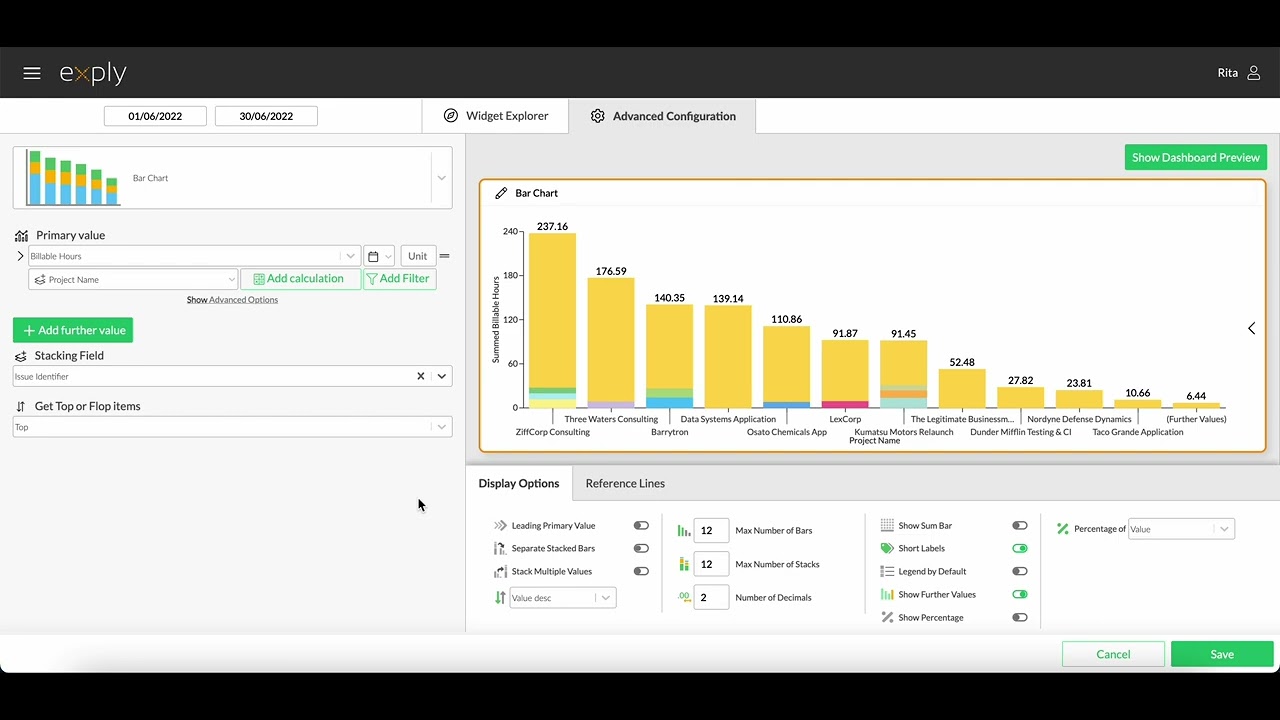
How To Create a Bar Chart
![](https://img.youtube.com/vi/MxDLXuqvjQ4/maxresdefault.jpg)
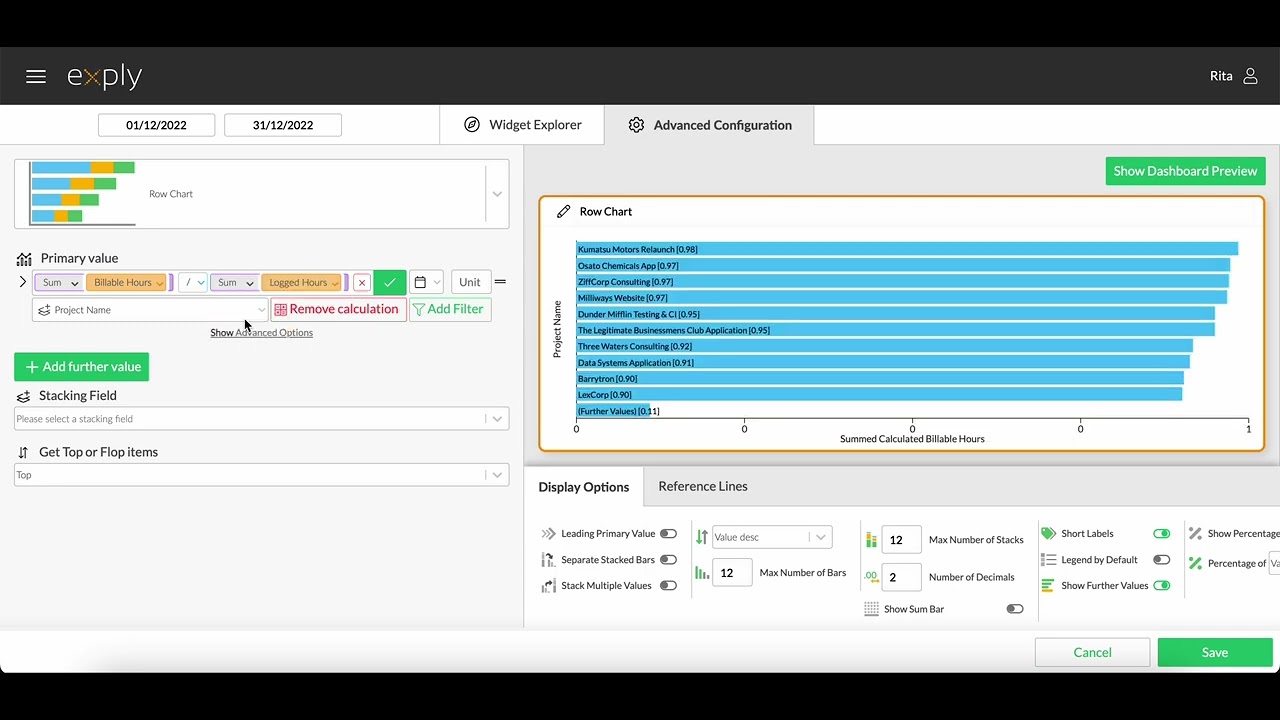
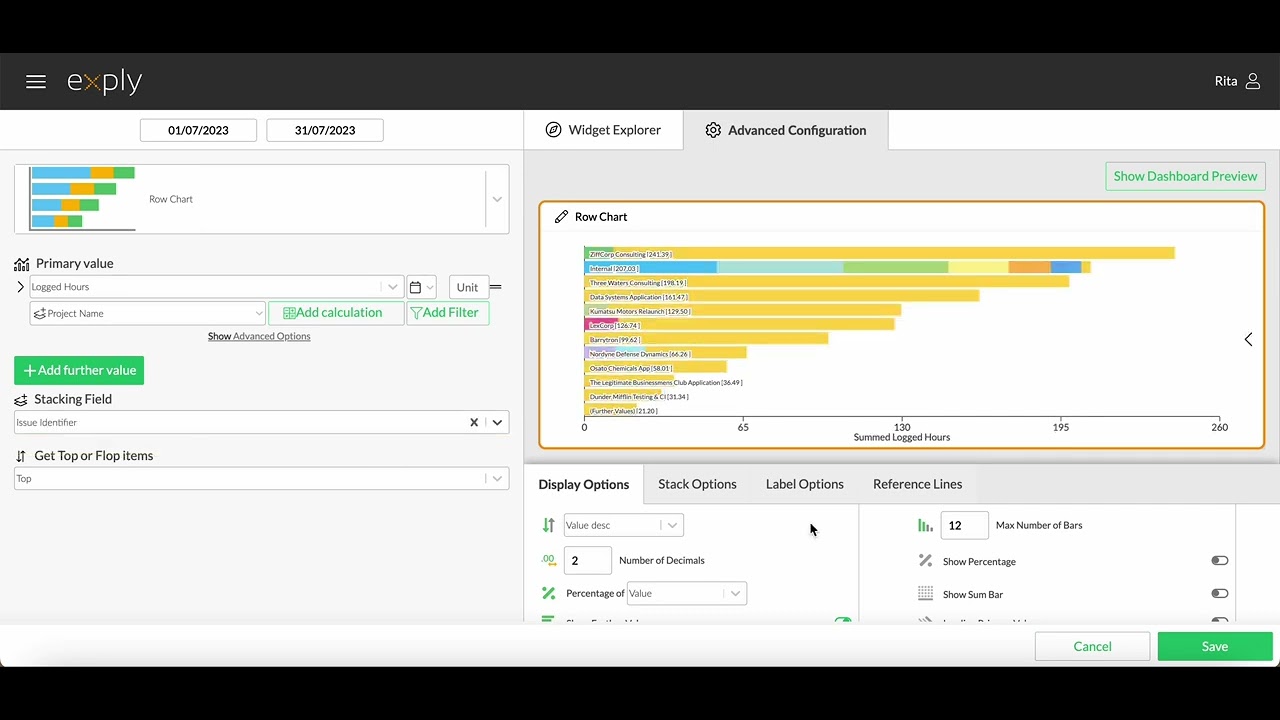
How To Create a Row Chart
![](https://img.youtube.com/vi/NON_oYxQVJ4/maxresdefault.jpg)
Add Stacks to Bar Chart
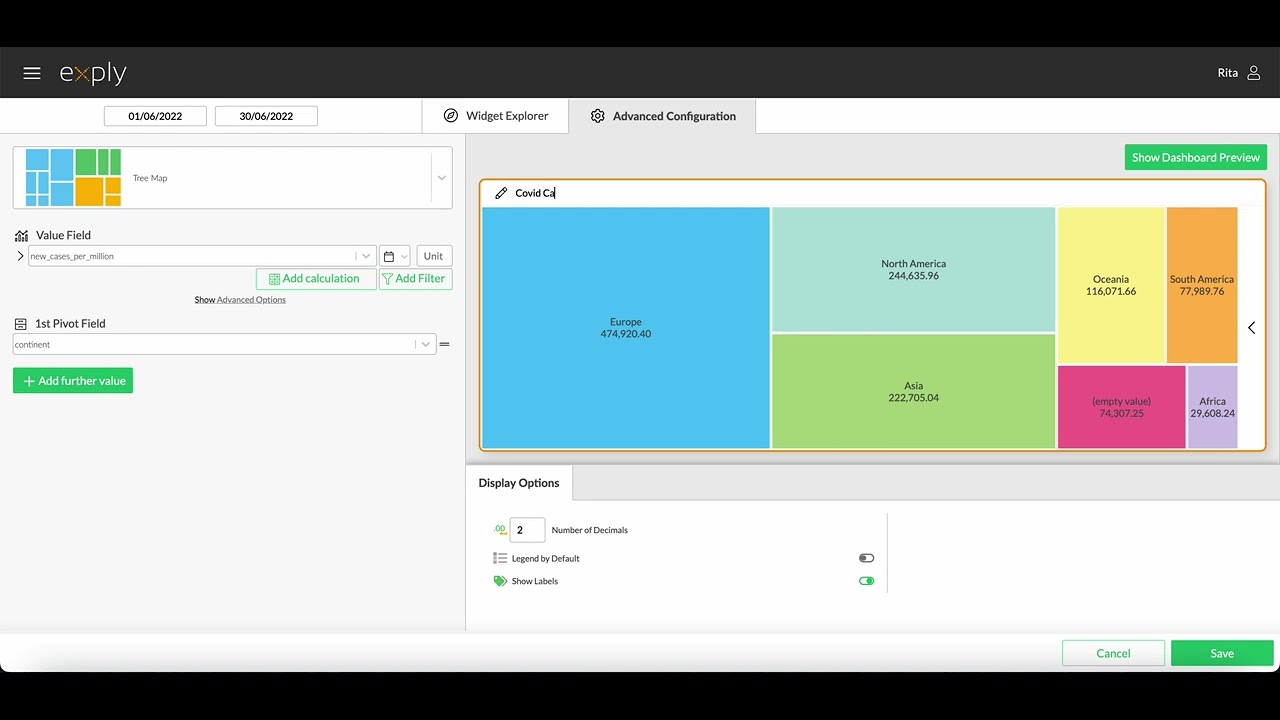
![](https://img.youtube.com/vi/2Nyum2KV1hY/maxresdefault.jpg)
Creating a Tree Map
![](https://img.youtube.com/vi/OGY02CuSmu8/maxresdefault.jpg)
Creating a Filtered Treemap
![](https://img.youtube.com/vi/CC7Prl5ZQj0/maxresdefault.jpg)
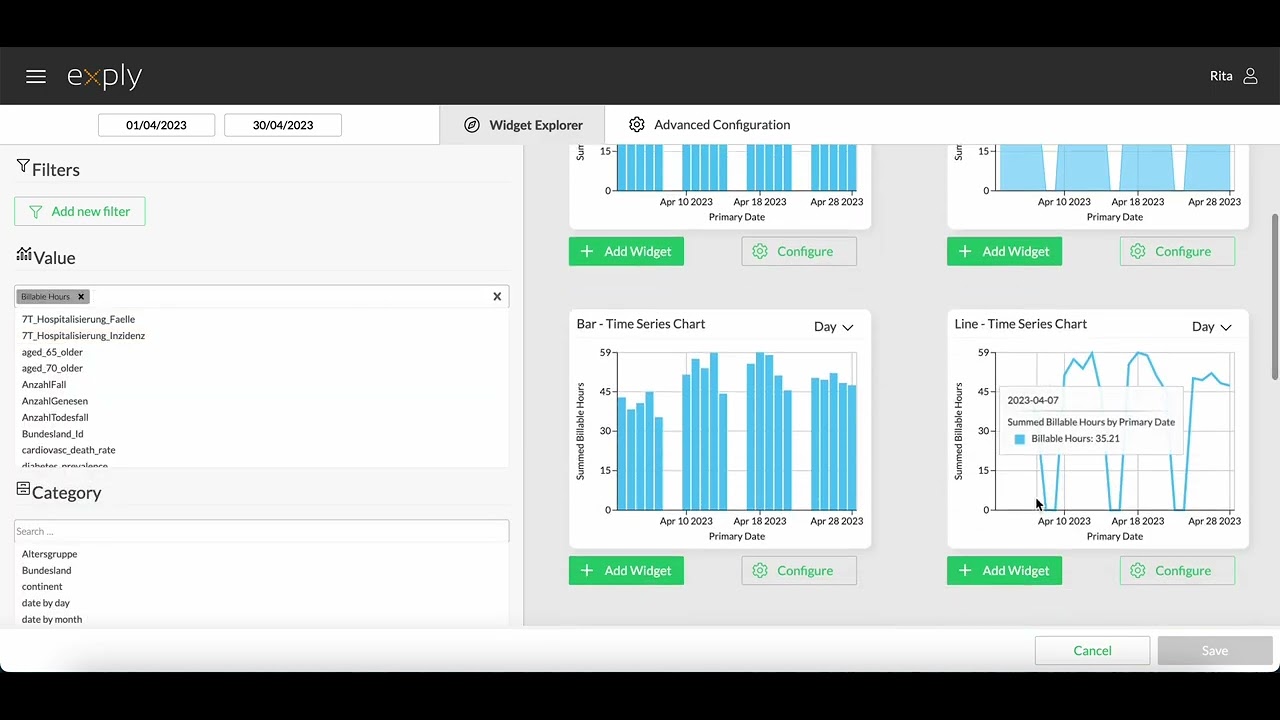
Creating a Line Time Series Chart
![](https://img.youtube.com/vi/PRTo4oktwd4/maxresdefault.jpg)
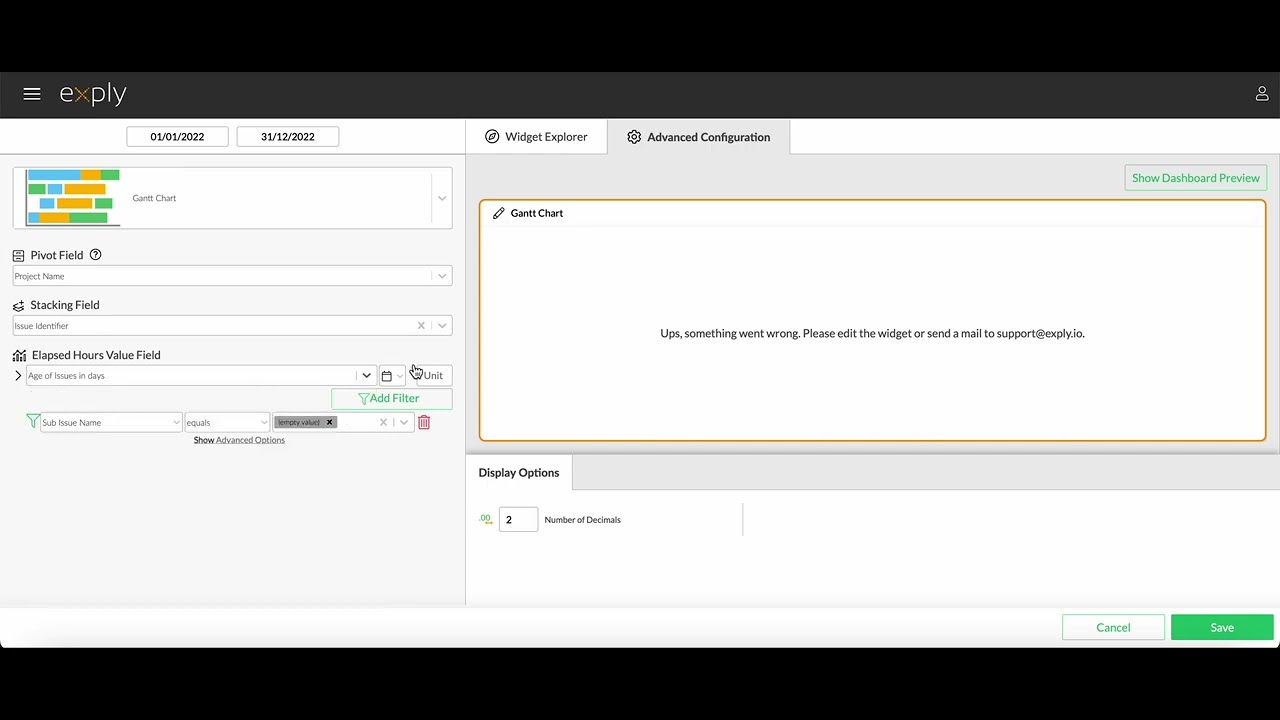
Creating a Gantt Chart
![](https://img.youtube.com/vi/VBpJh8lm-qY/maxresdefault.jpg)
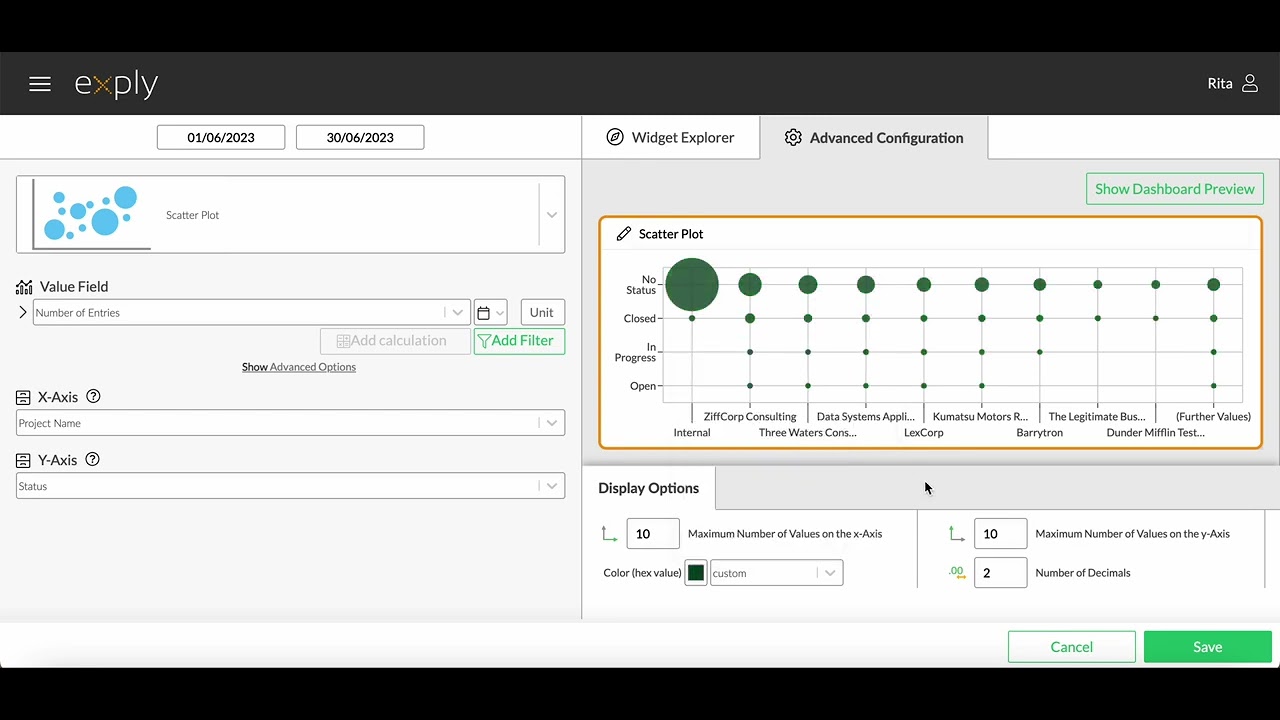
Creating a Scatter Plot
![](https://img.youtube.com/vi/ki9NGCp_u9I/maxresdefault.jpg)
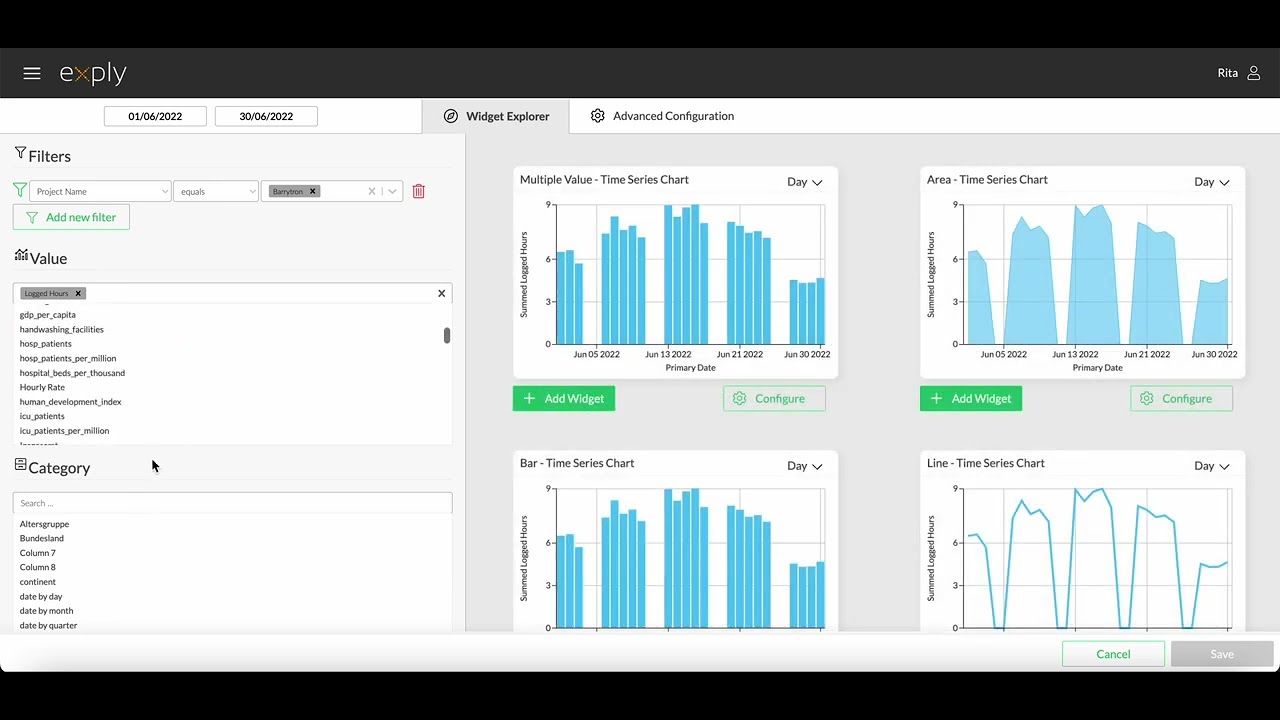
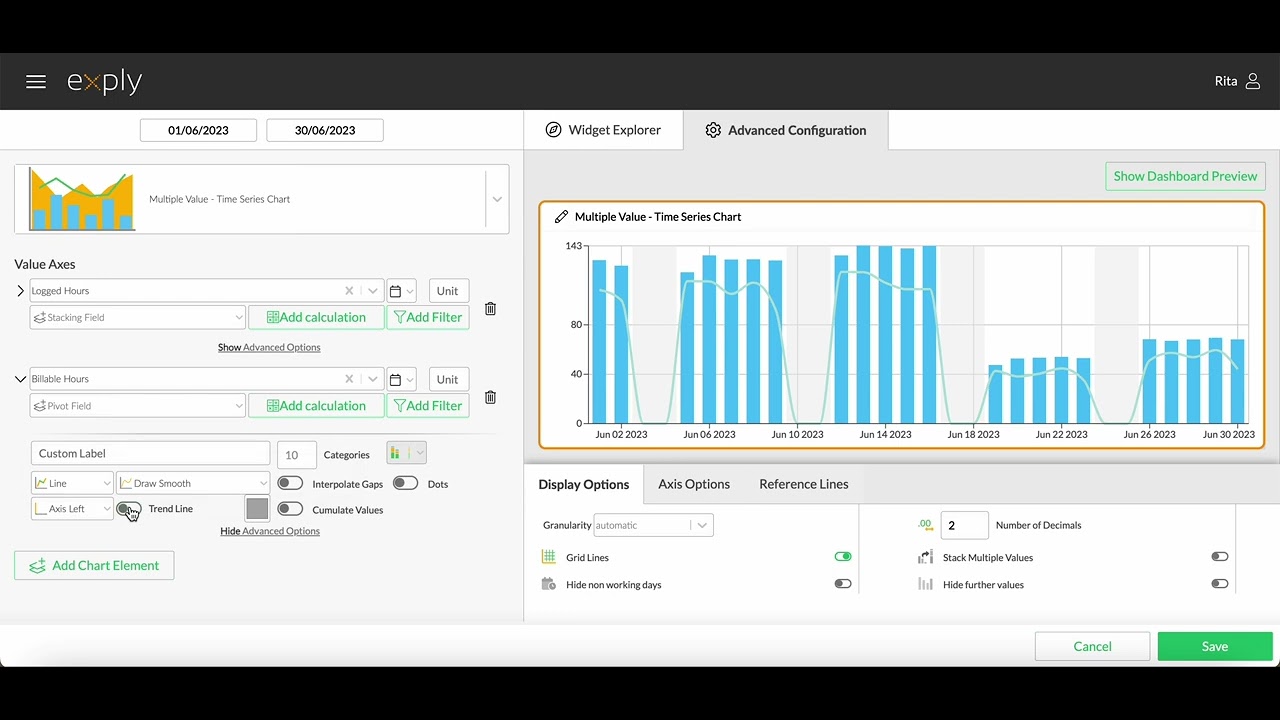
Creating a Multiple Value Time Series Chart
![](https://img.youtube.com/vi/DvBG59Ljq_w/maxresdefault.jpg)
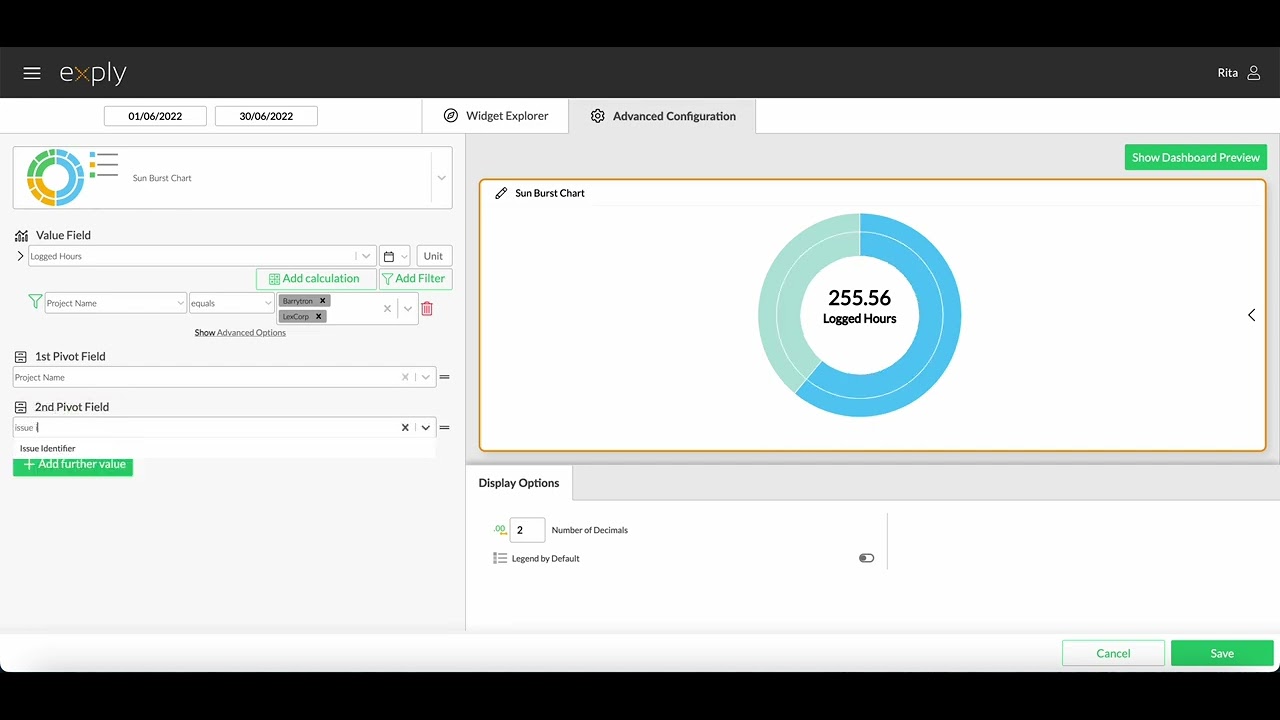
Advanced Configuration of Sunburst Chart
![](https://img.youtube.com/vi/k0p8UcftxJk/maxresdefault.jpg)
Adding Calculations
![](https://img.youtube.com/vi/KermyW6j93s/maxresdefault.jpg)