Filters
How to filter data
Filtering data in Exply can be achieved in various ways:
- Data filter in Widgets
- Quick Filter Widget (on-demand)
- Values in interactive Charts (on-demand)
- Data filter for Dashboards and Widget Groups (permanent)
- Data filter via User Management (permanent)
1. Data filter in Widgets
To narrow the shown data down in a certain Widget to a specific aspect, the easiest way is to set a filter in the Widget itself. That way only this Widget will be affected by the filter.
You can add filters during the creation process via the Widget Explorer in the top left corner:
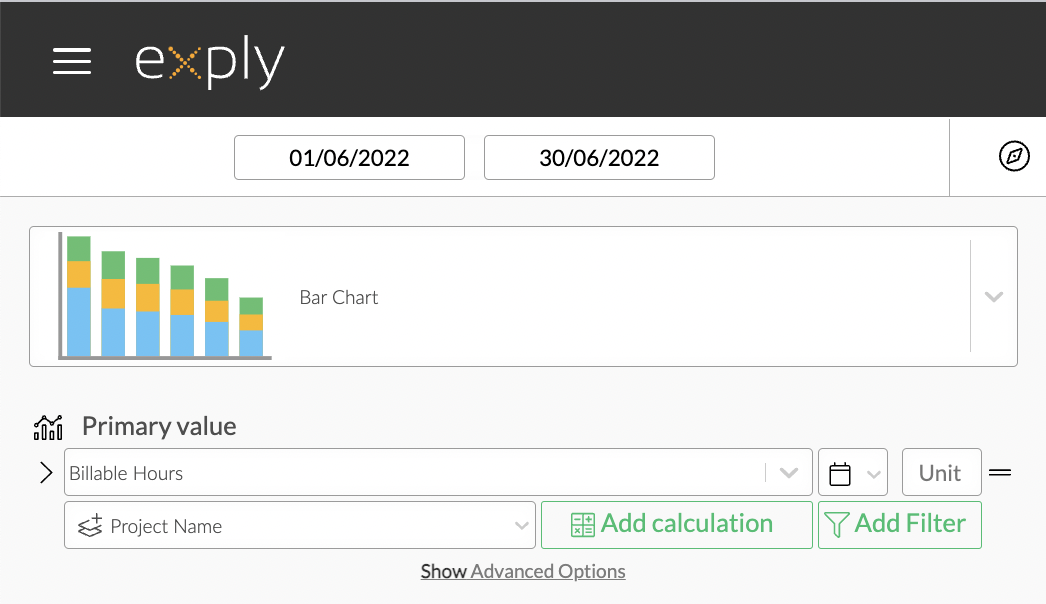
Filter in Widget Explorer
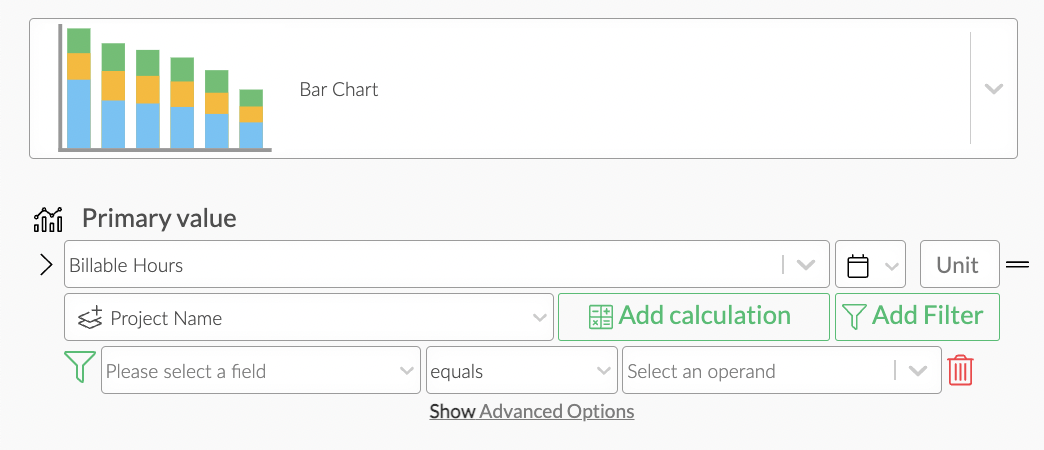
Added one Filter in Widget Explorer
The second option to add filters for specific widgets is to directly switch to the advanced configuration.
Filter in Advanced Configuration
Added one Filter in Advanced Configuration
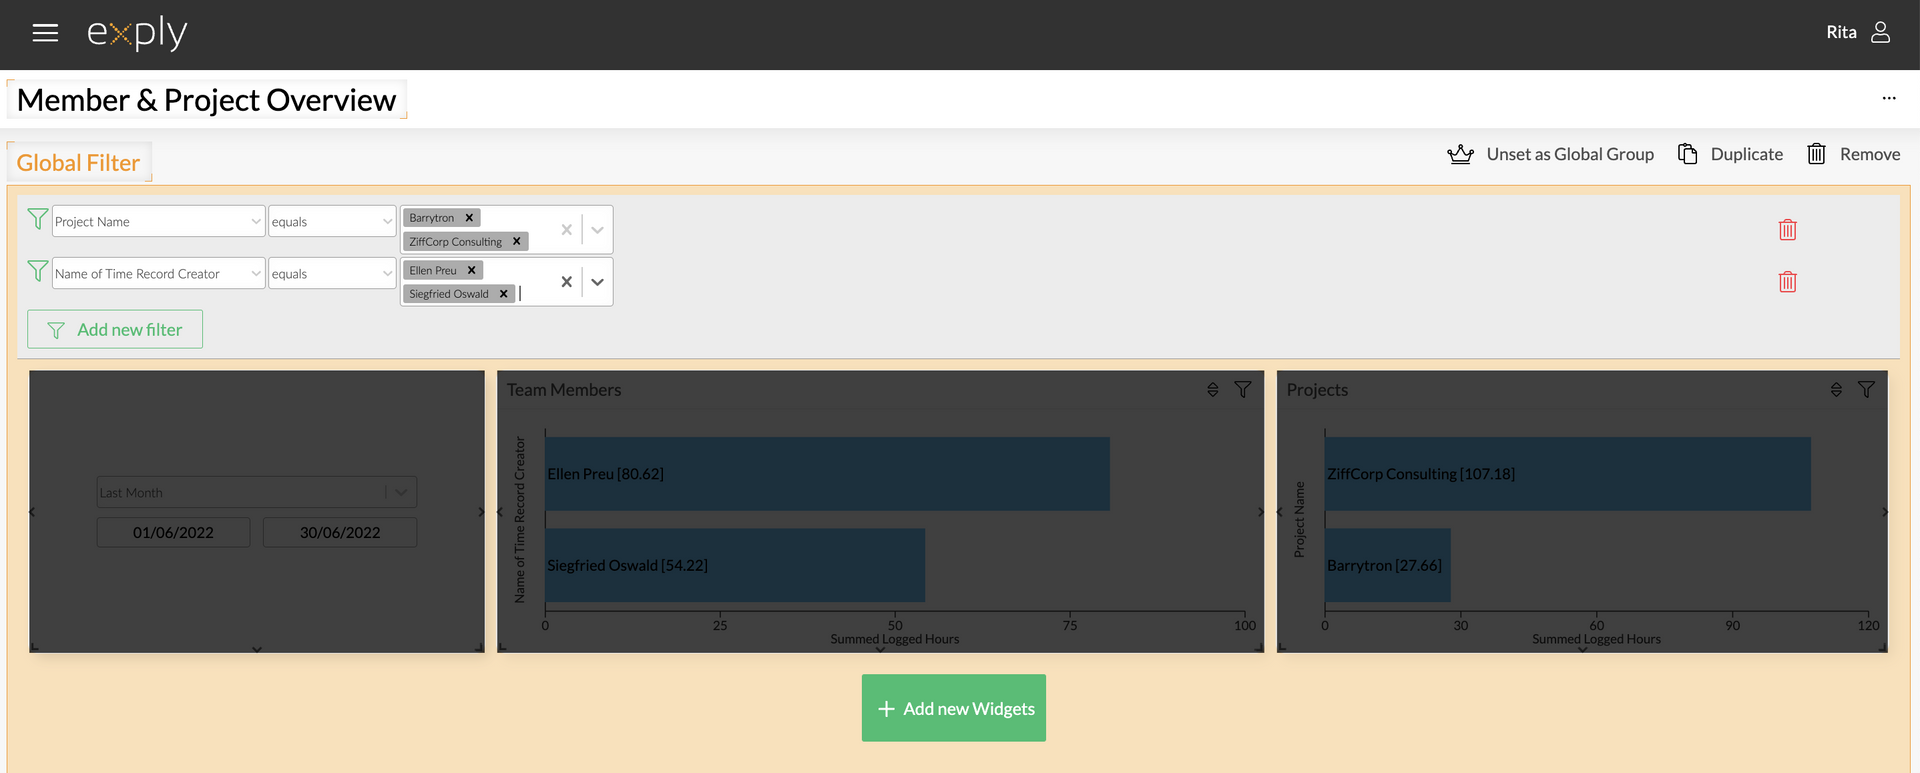
2. Data filter with the Quick Filter Widget
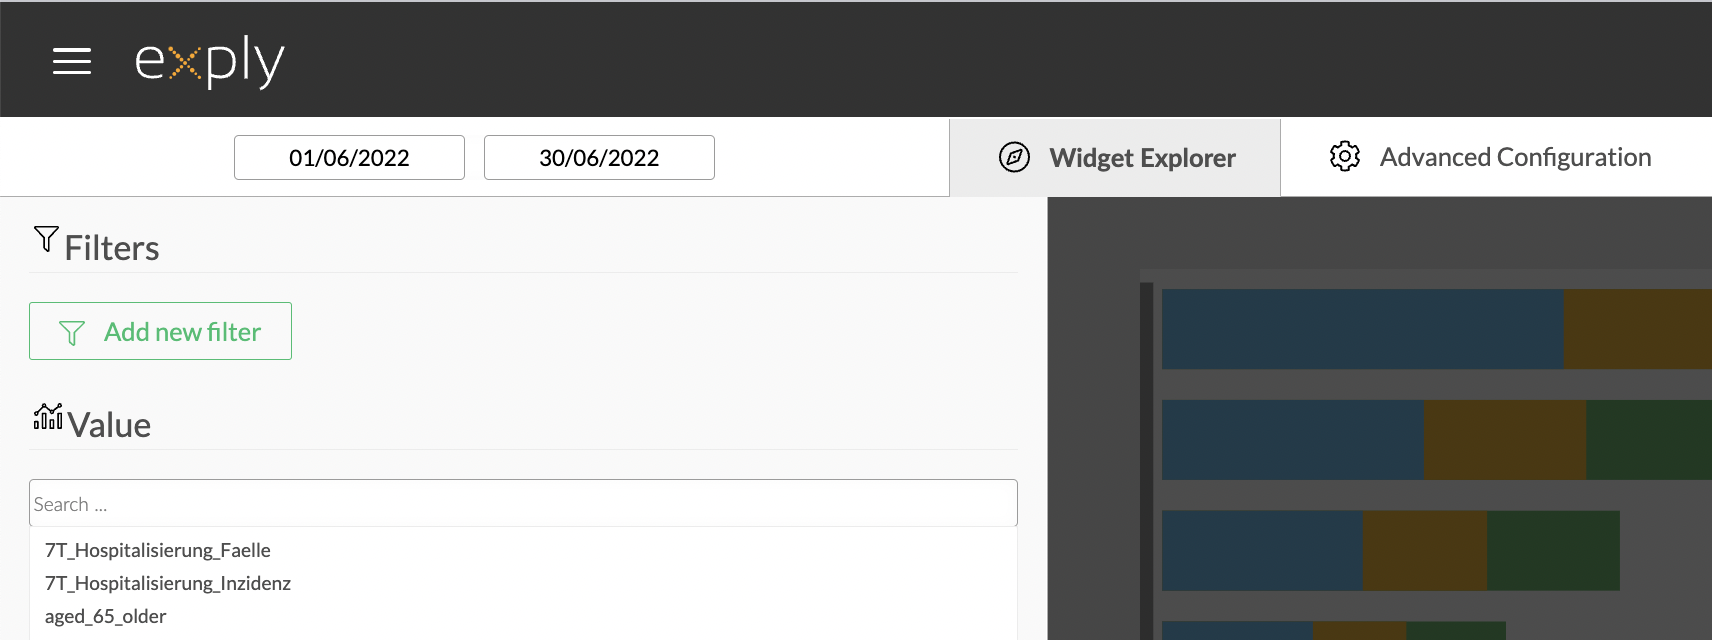
The second way to add filters to your Dashboard is to add the Quick Filter Widget.
There are multiple ways to configure the Quick Filter Widget:
- Select category and (multiple) operand(s)
- Select category and leave the operand empty
- Combine both
Every filter will be automatically named based on the chosen criteria. You can also give the filters custom names if so desired.
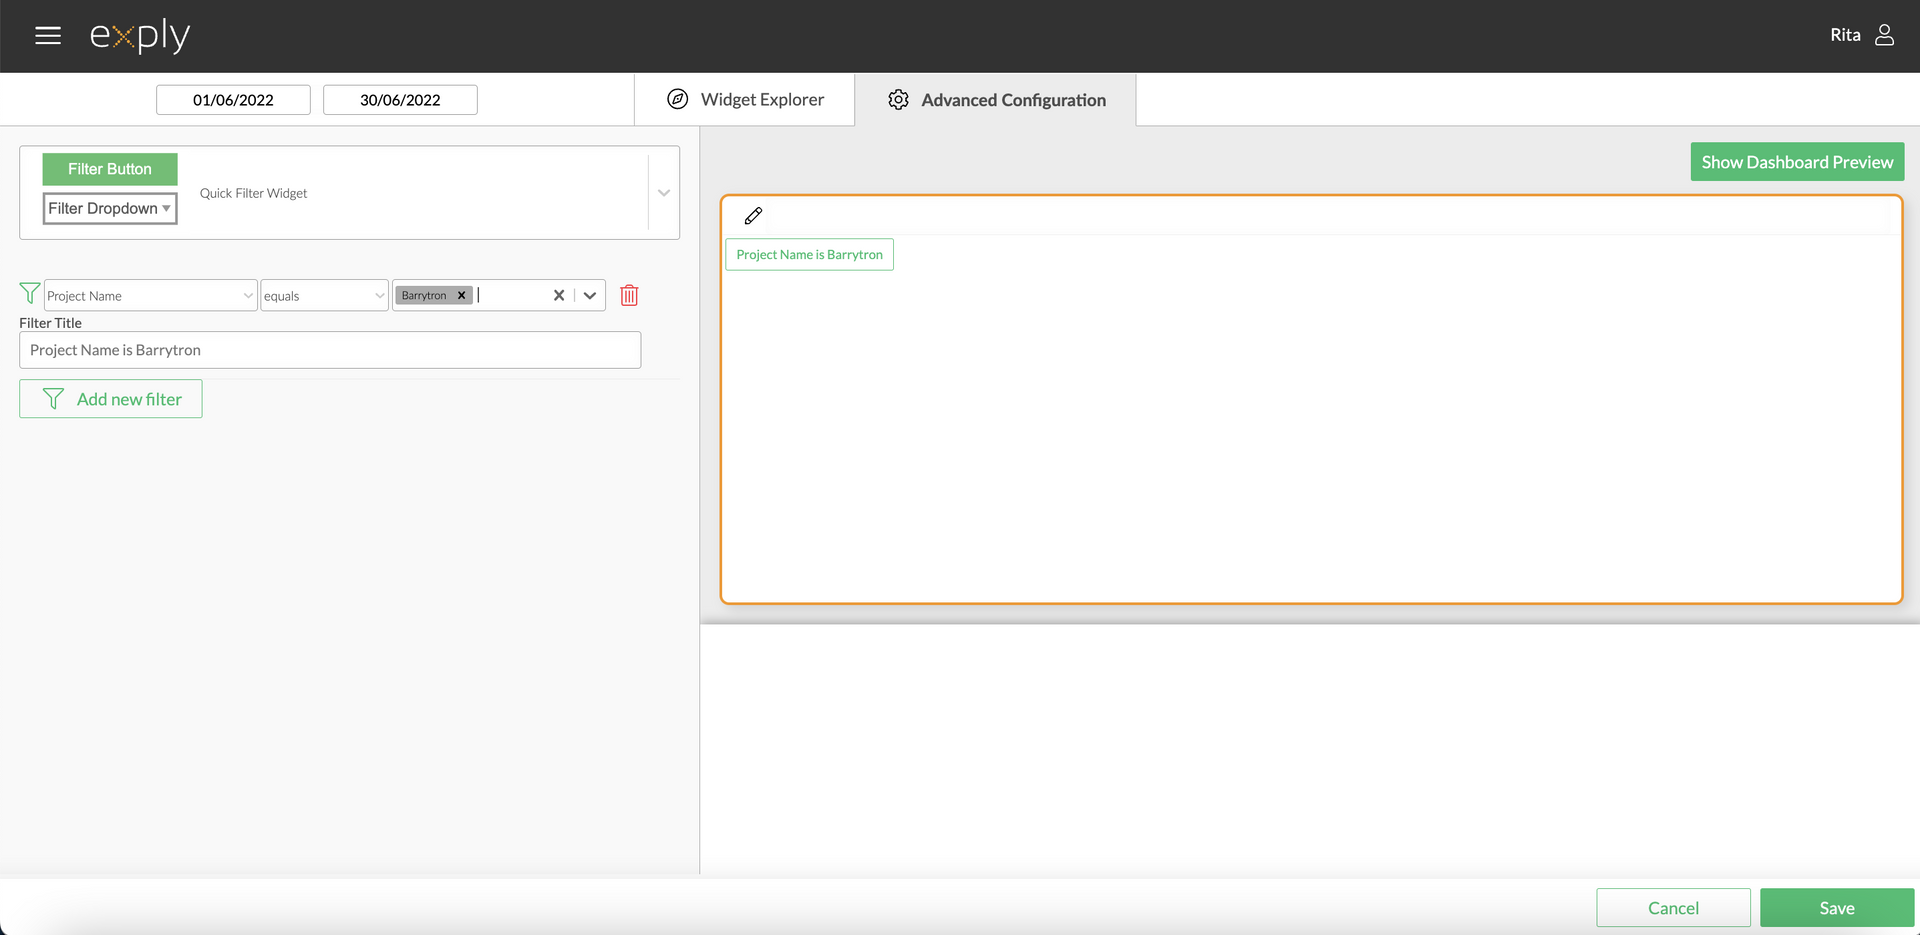
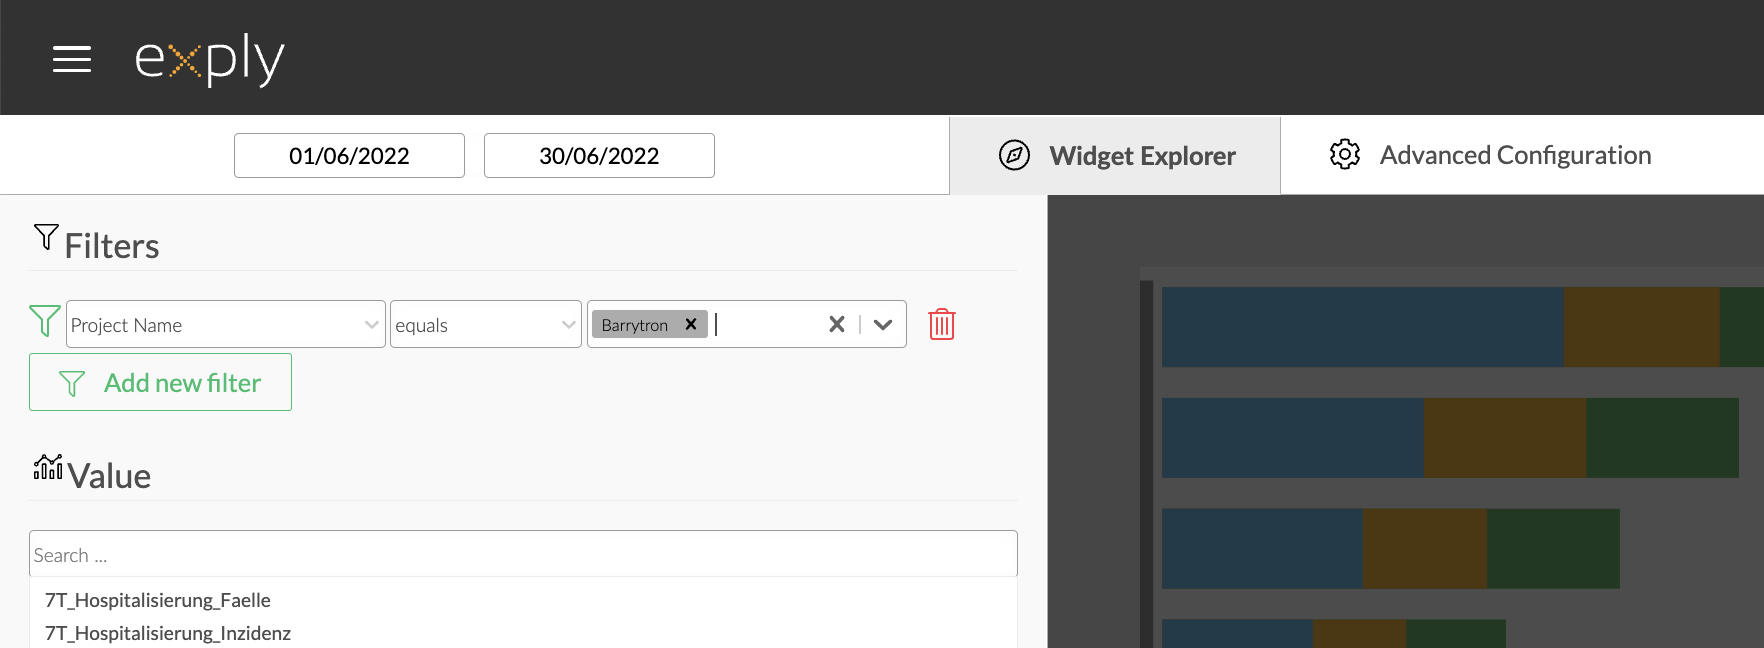
1. Quick Filter Widget with selected category (Project) and operand (Barrytron). This filter is activated with one click.

2. Quick Filter Widget with selected category (Project) and empty operand. This filter gives you a dropdown list to choose from.
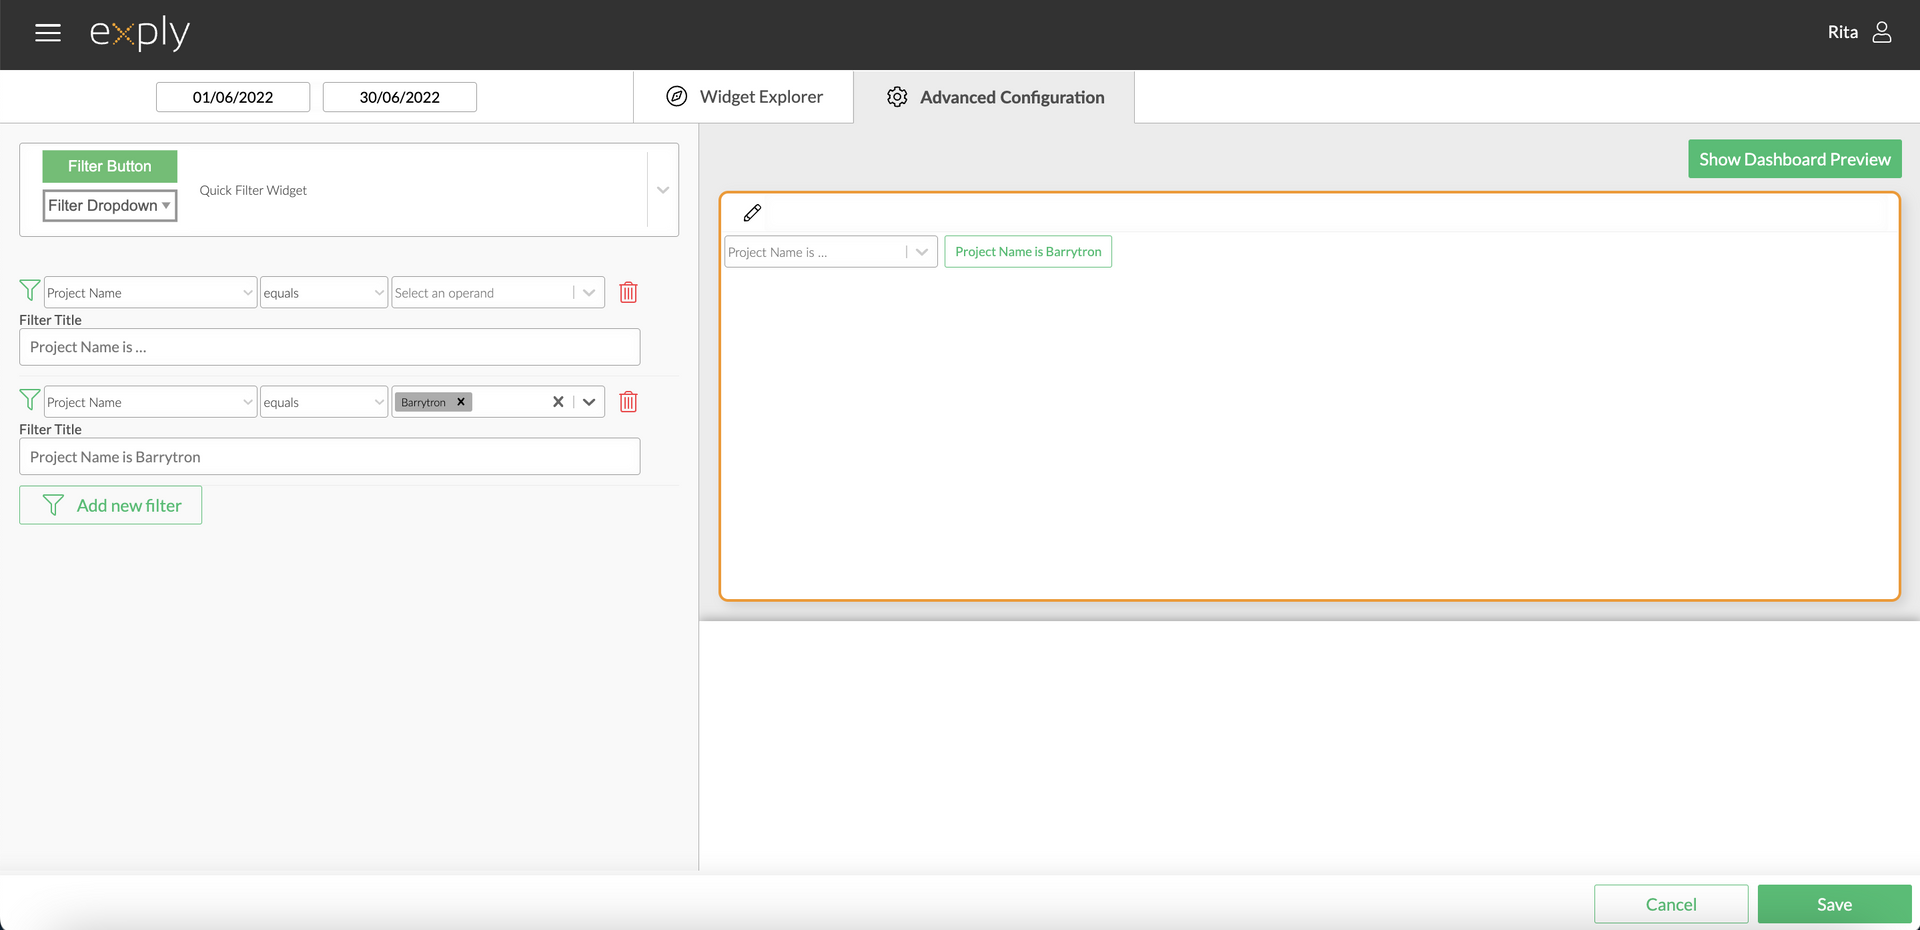
3. Quick Filter Widget with selected category (Project) and operand (Narrow Calculator) combined with selected category (Project) and empty operand.
3. Values in interactive Charts (on demand)
The third way to configure filters is to directly use your widget-values as filters. Almost every widget can be used as a filter (excl. Metric Tile). Just click on the value you would like to see more and all other widgets will react to your selection. Use Ctrl (or Cmd on Mac) to select multiple values.
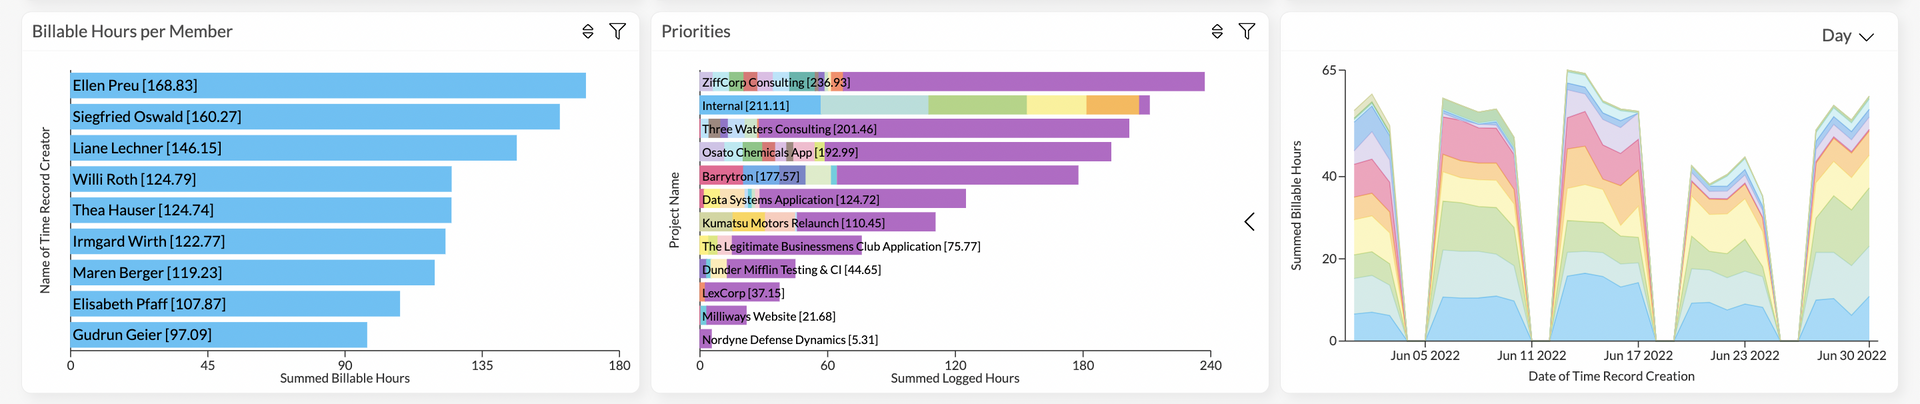
Dashboard details with no filters activated
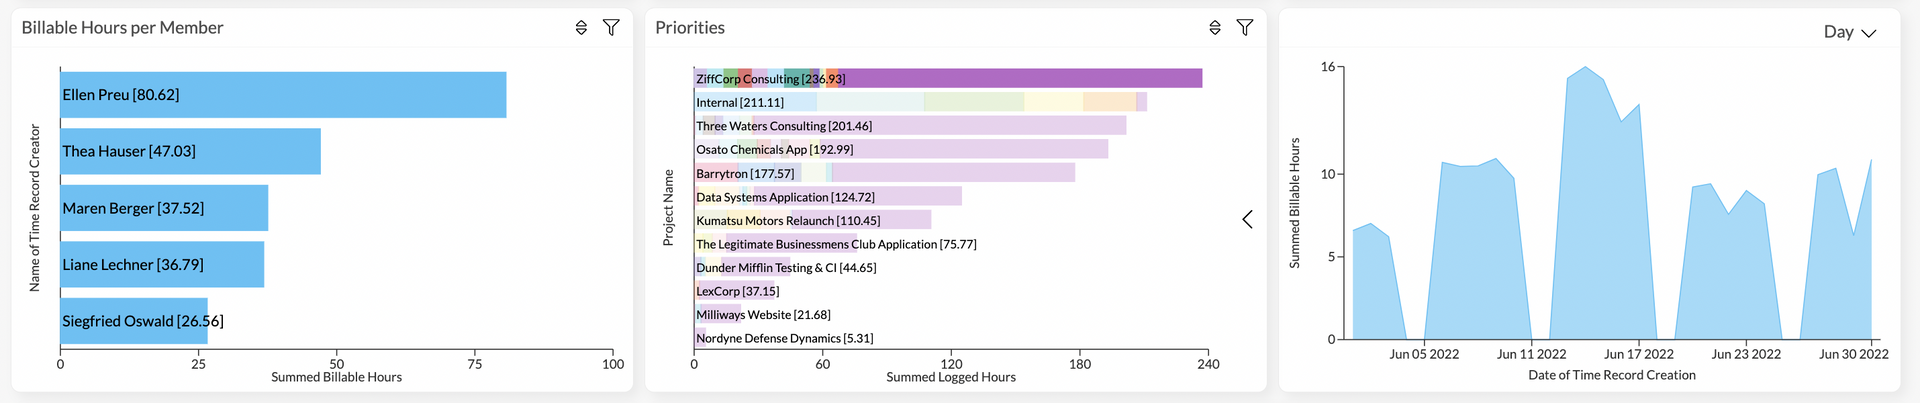
In this case, the project ZiffCorp has been selected. The "Billable Hours per Member" and "Date of Time Record Creation" Widget now only show data related to the selected project.
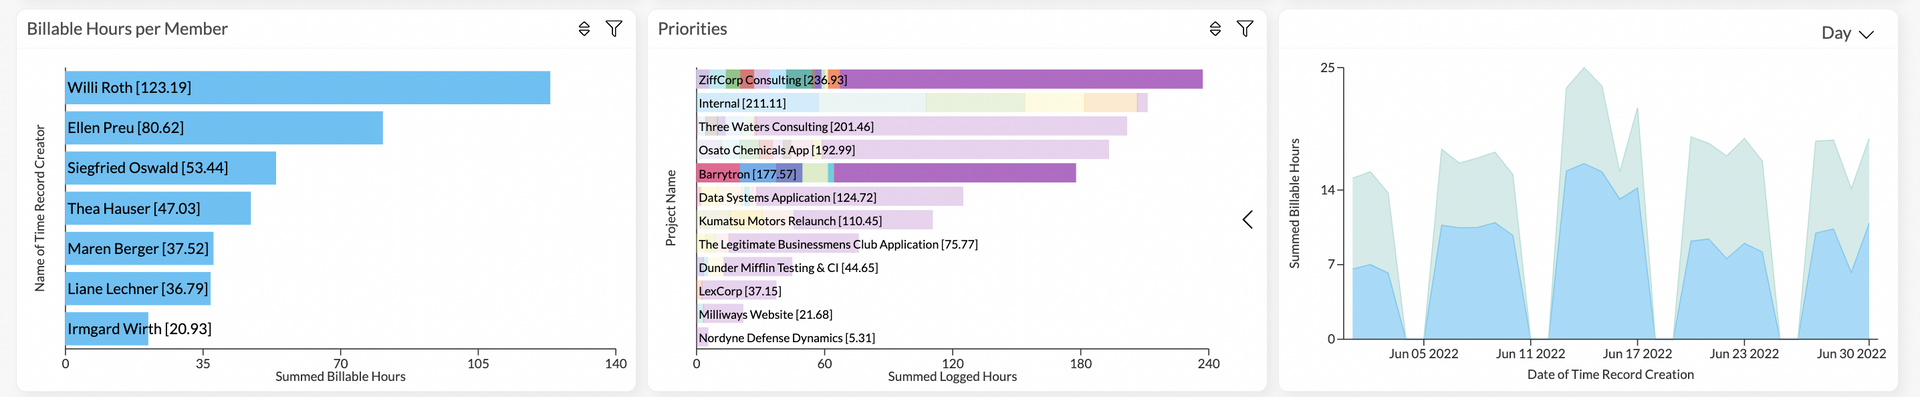
Using Ctrl (or Cmd on Mac) multiple values can be selected. In this example ZiffCorp and Barrytron have been selected. The Widgets next to it now show related data.
4. Data filters for Dashboards and Widget Groups (permanent)
To (permanently) restrict the shown data within a Dashboard or Widget Group, you can add filters to them.
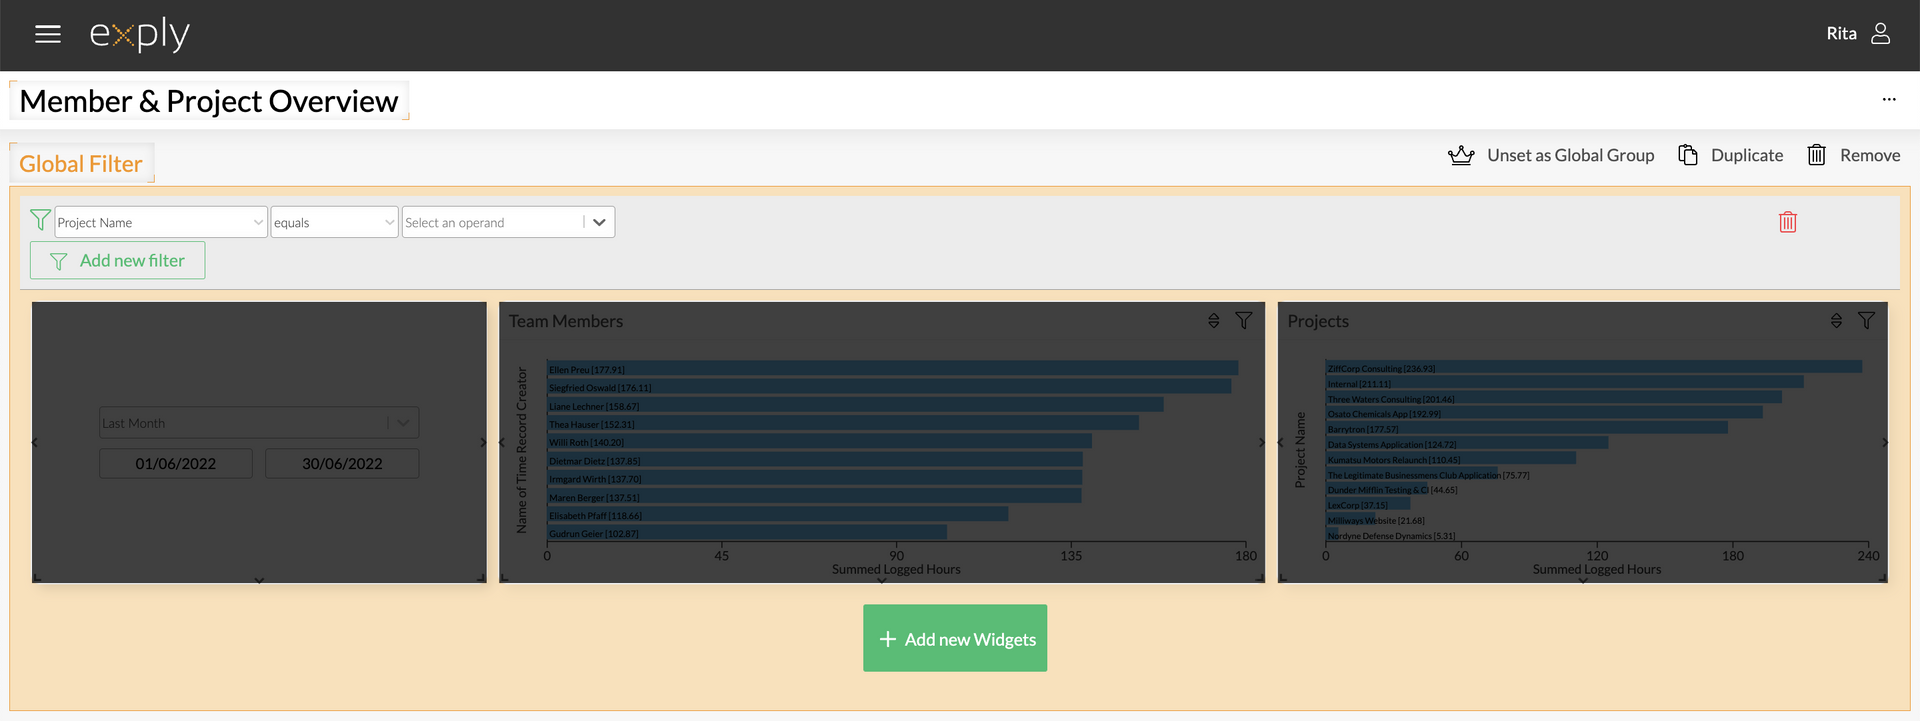
Dashboard filter in edit mode
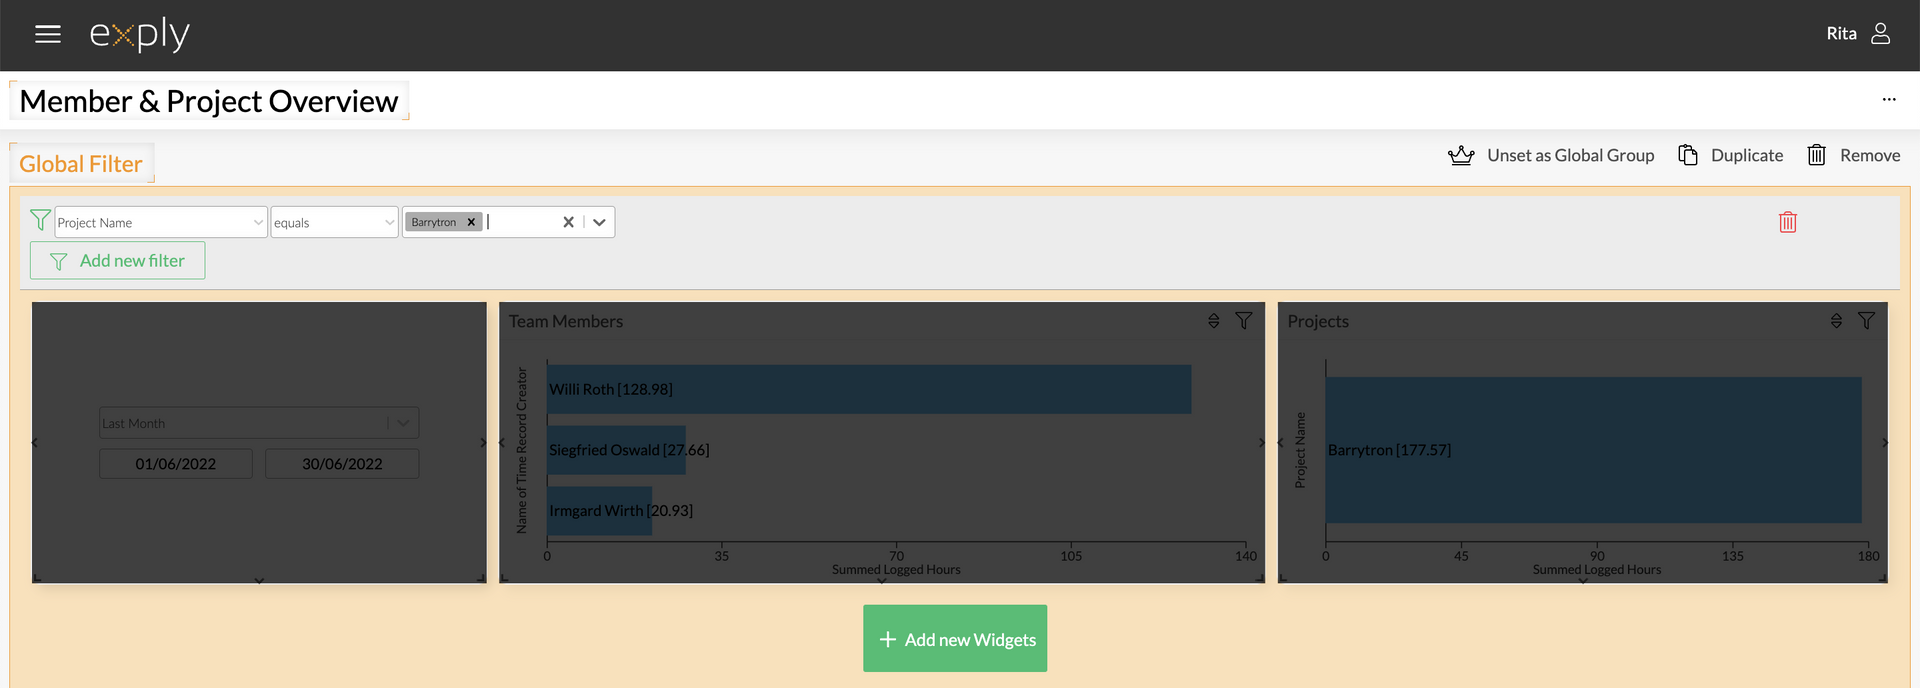
Dashboard filter in edit mode with one filter and operand
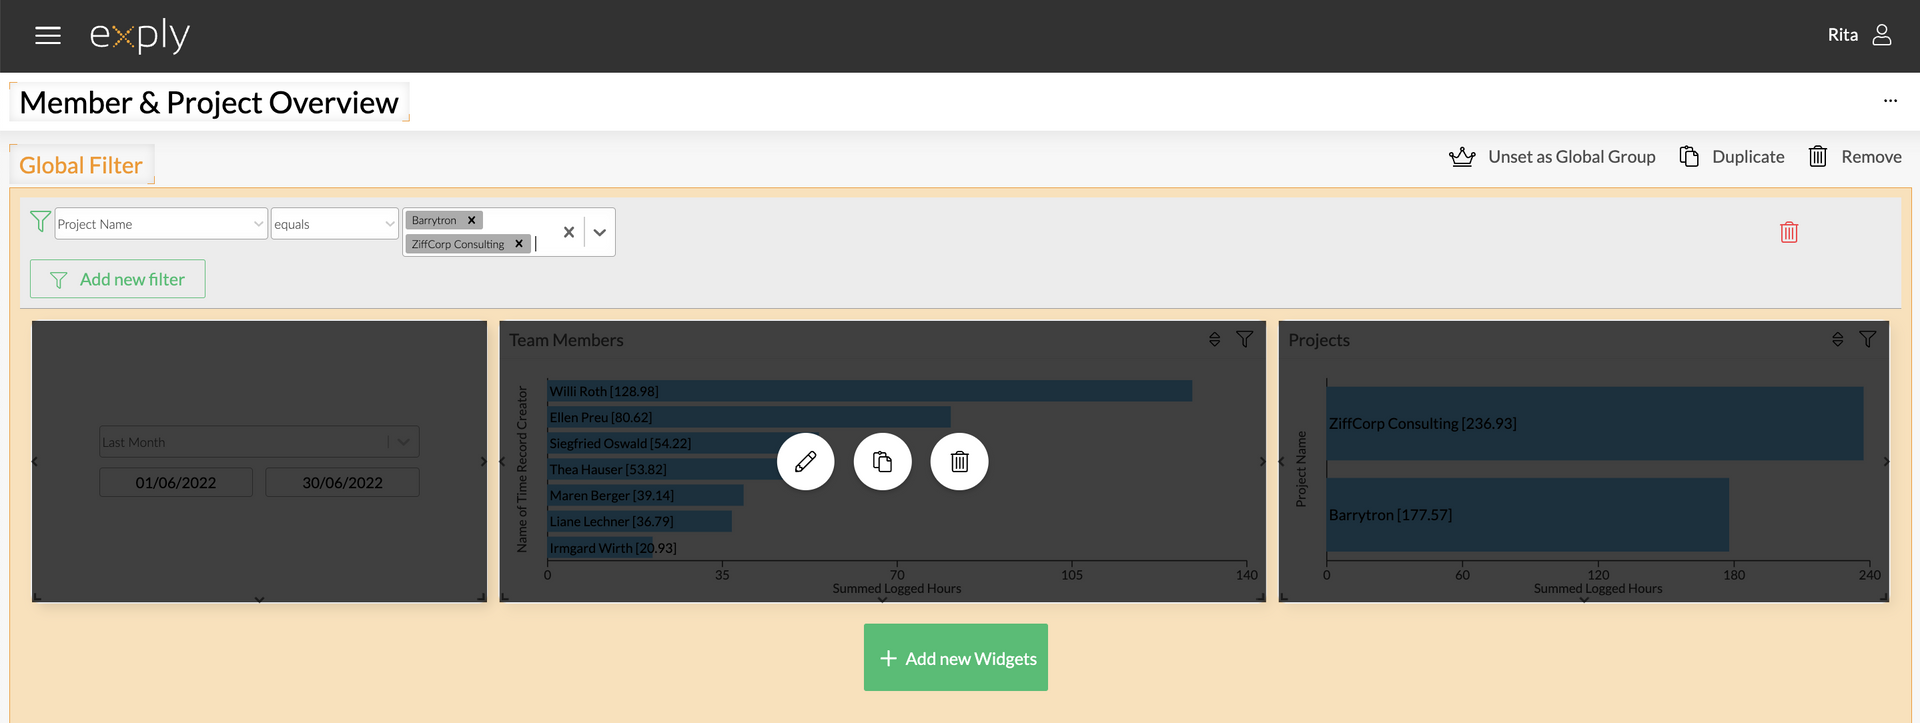
Dashboard filter in edit mode with one filter and multiple operands
Dashboard filter in edit mode with multiple filters and multiple operands
5. Data filters via User Management (permanent)
Sometime it is necessary to restrict access to data.
To (permanently) restrict the shown data within a Dashboard or Widget Group, you can add filters to them.
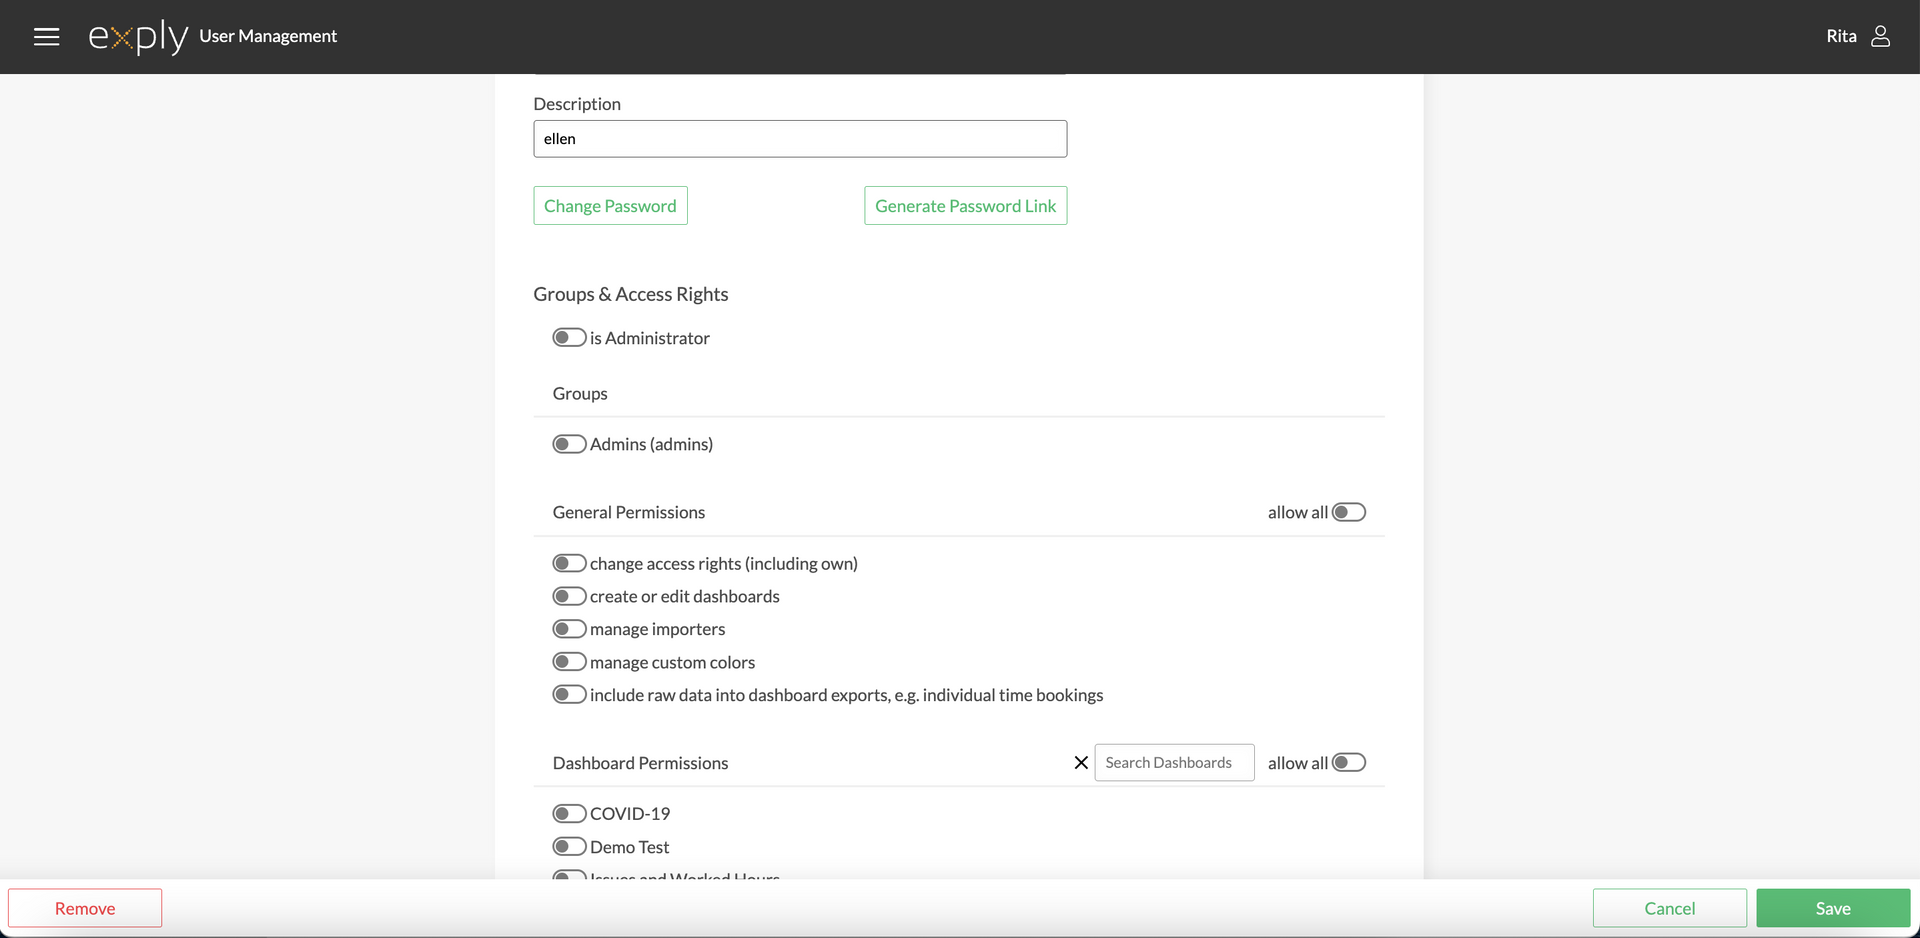
Per default all permissions are deactivated. We want you to explicitly activate permissions instead of accidentally exposing confidential data.
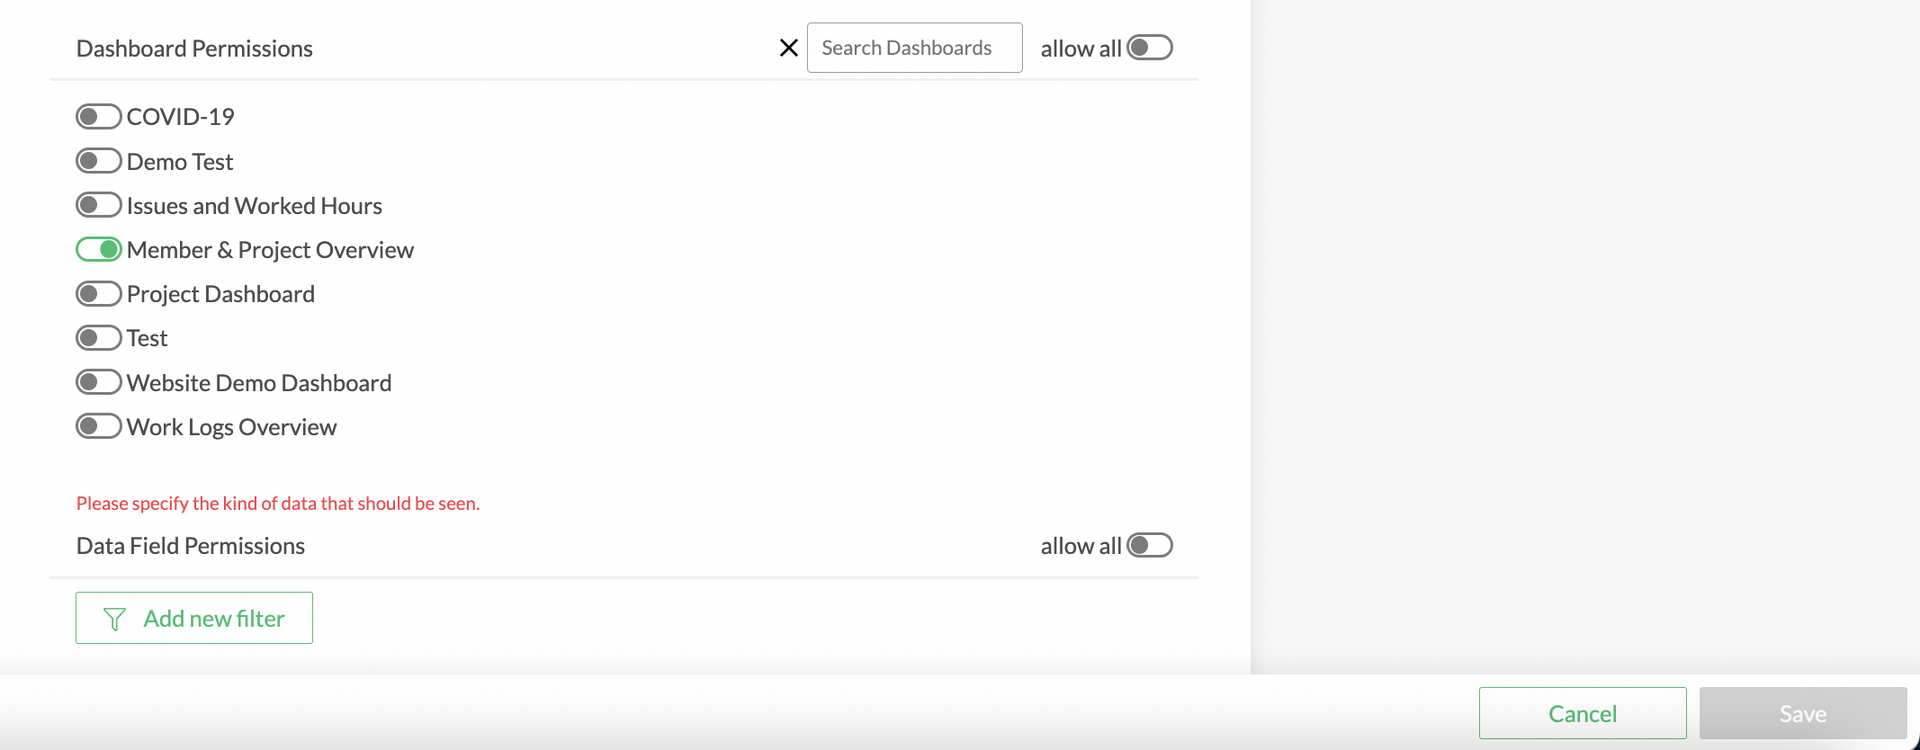
If you give access to Dashboards without giving access to data, the Dashboards will be empty. To prevent that, it will cause a validation error which will make it impossible to save the new user or group.
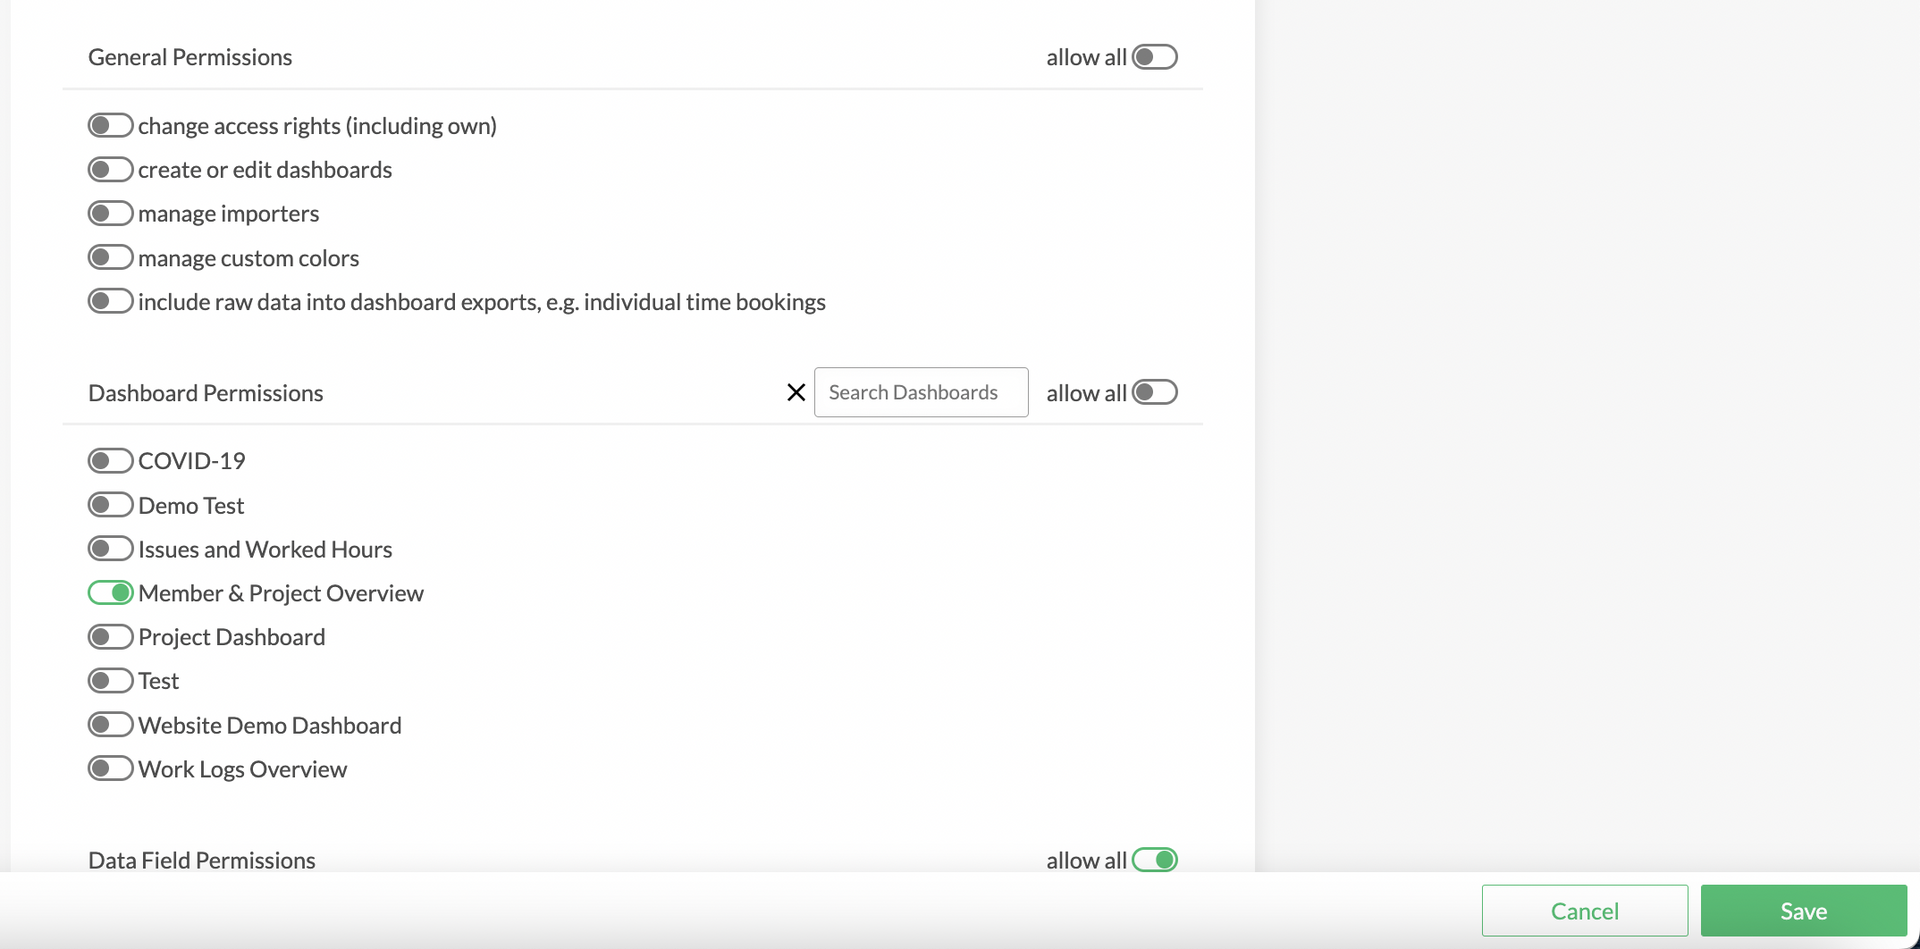
Allowing a user to view all data fields is the easiest way to let someone access a read-only Dashboard.
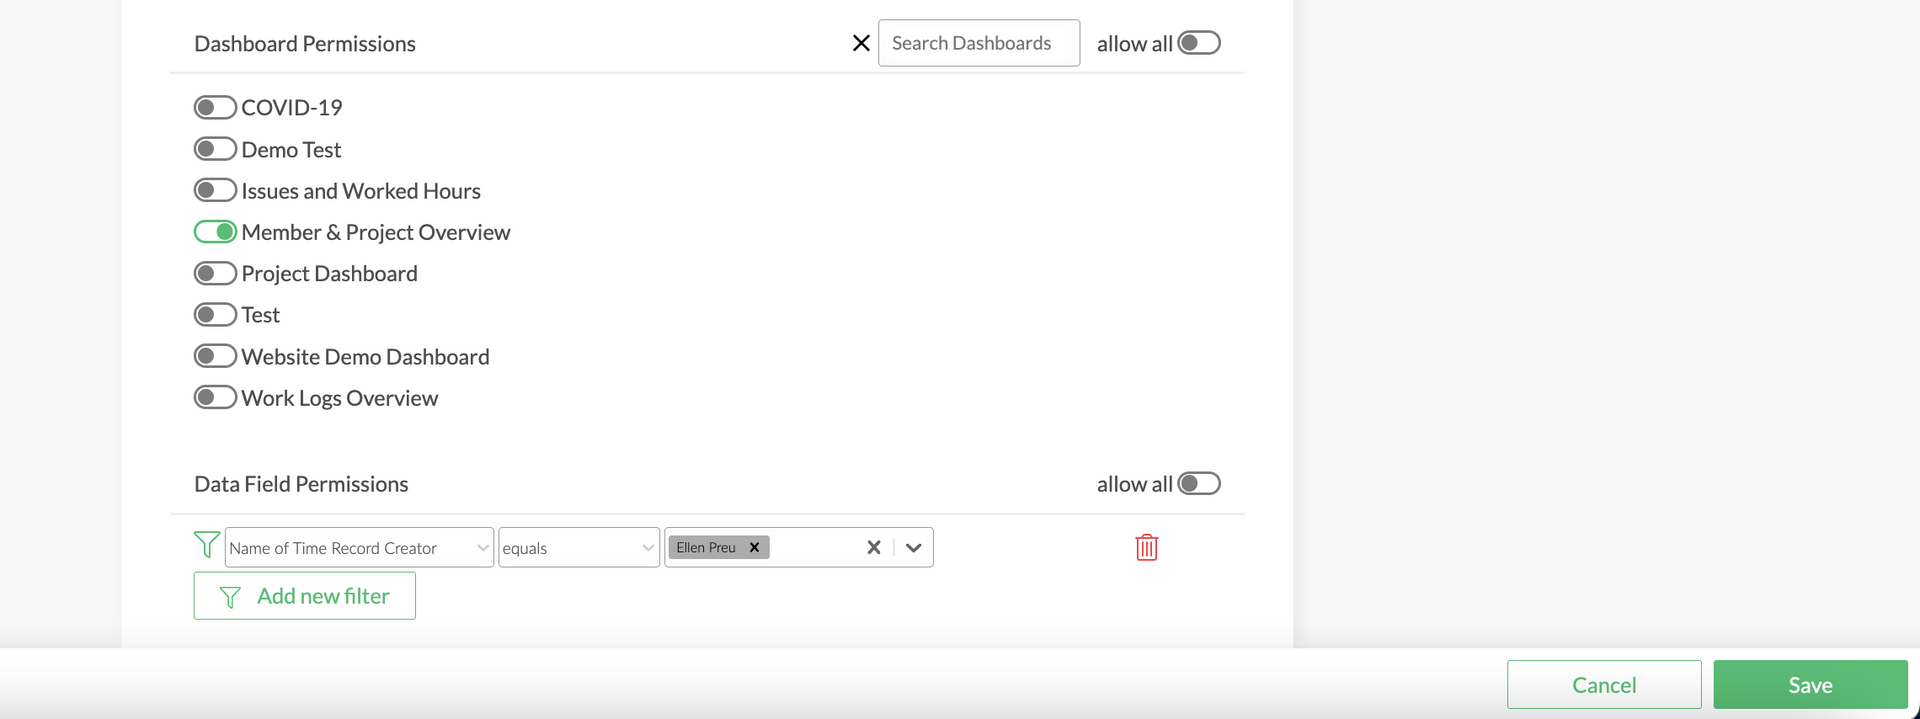
If e.g. customers need the option to edit their Dashboards, you'll probably want to restrict the access to their data only.