Scatter Plot
Overview
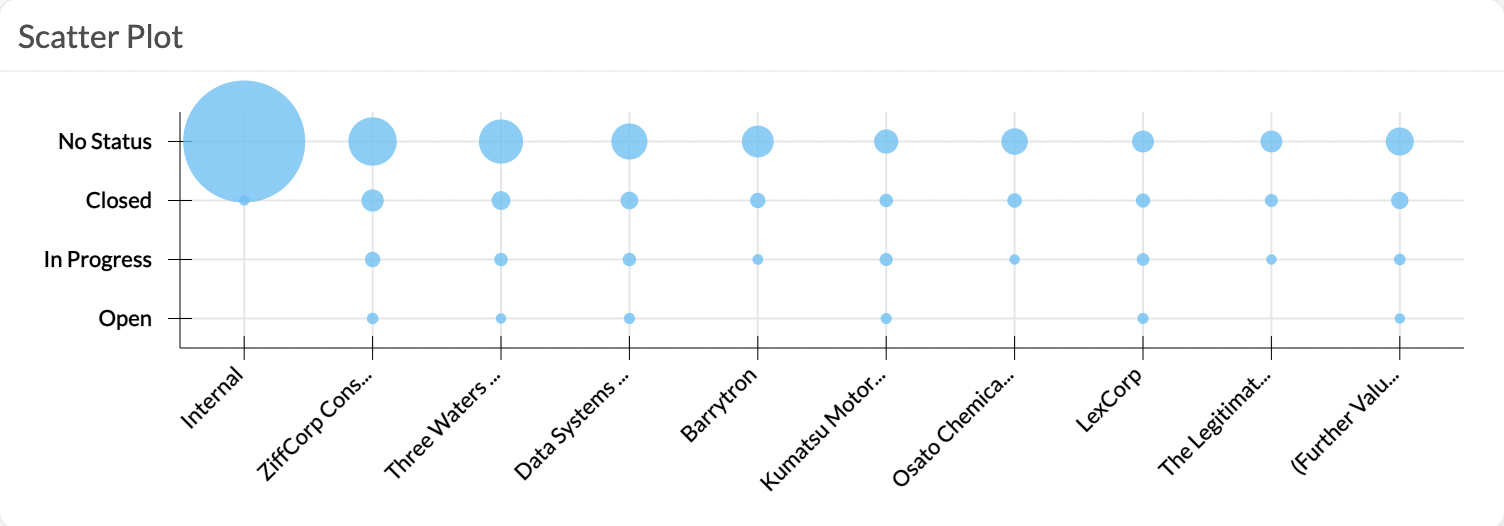
Scatter Plots give you a quick insight into the distribution of a value in different categories of your data set. The size of the individual circles in the chart correlates with the amount of the value.
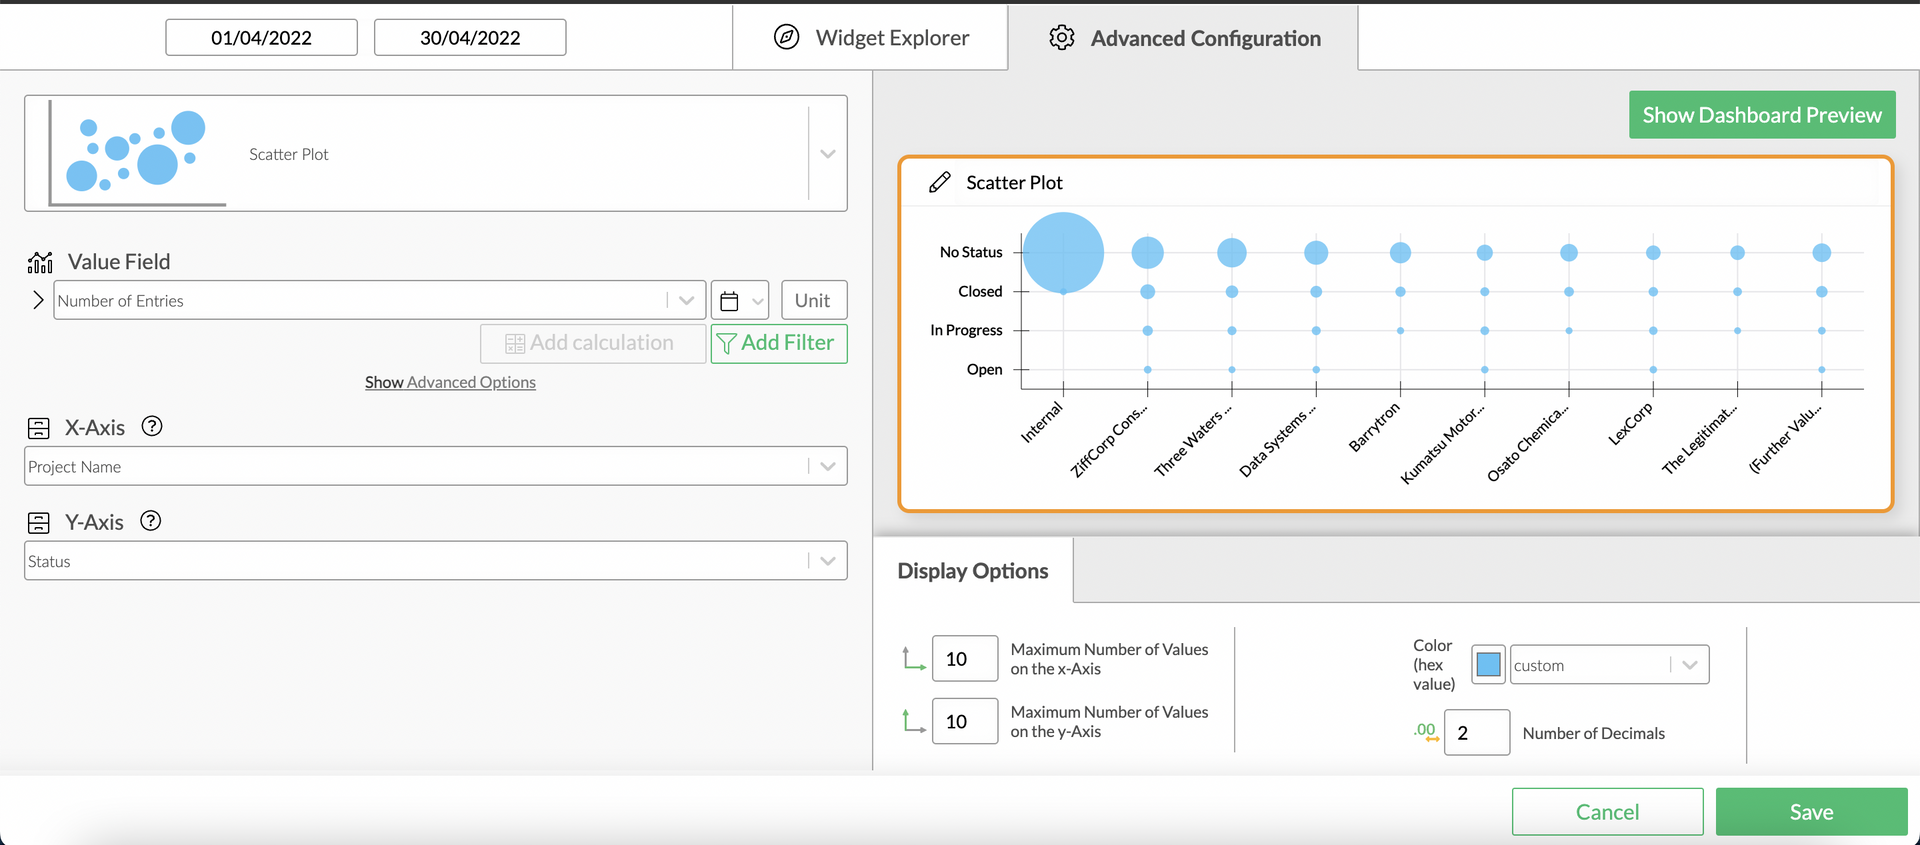
Scatter Plot Advanced Configuration Screen
Options
Every widget comes with a different set of options. All available options are described in the following passage.
Data Options
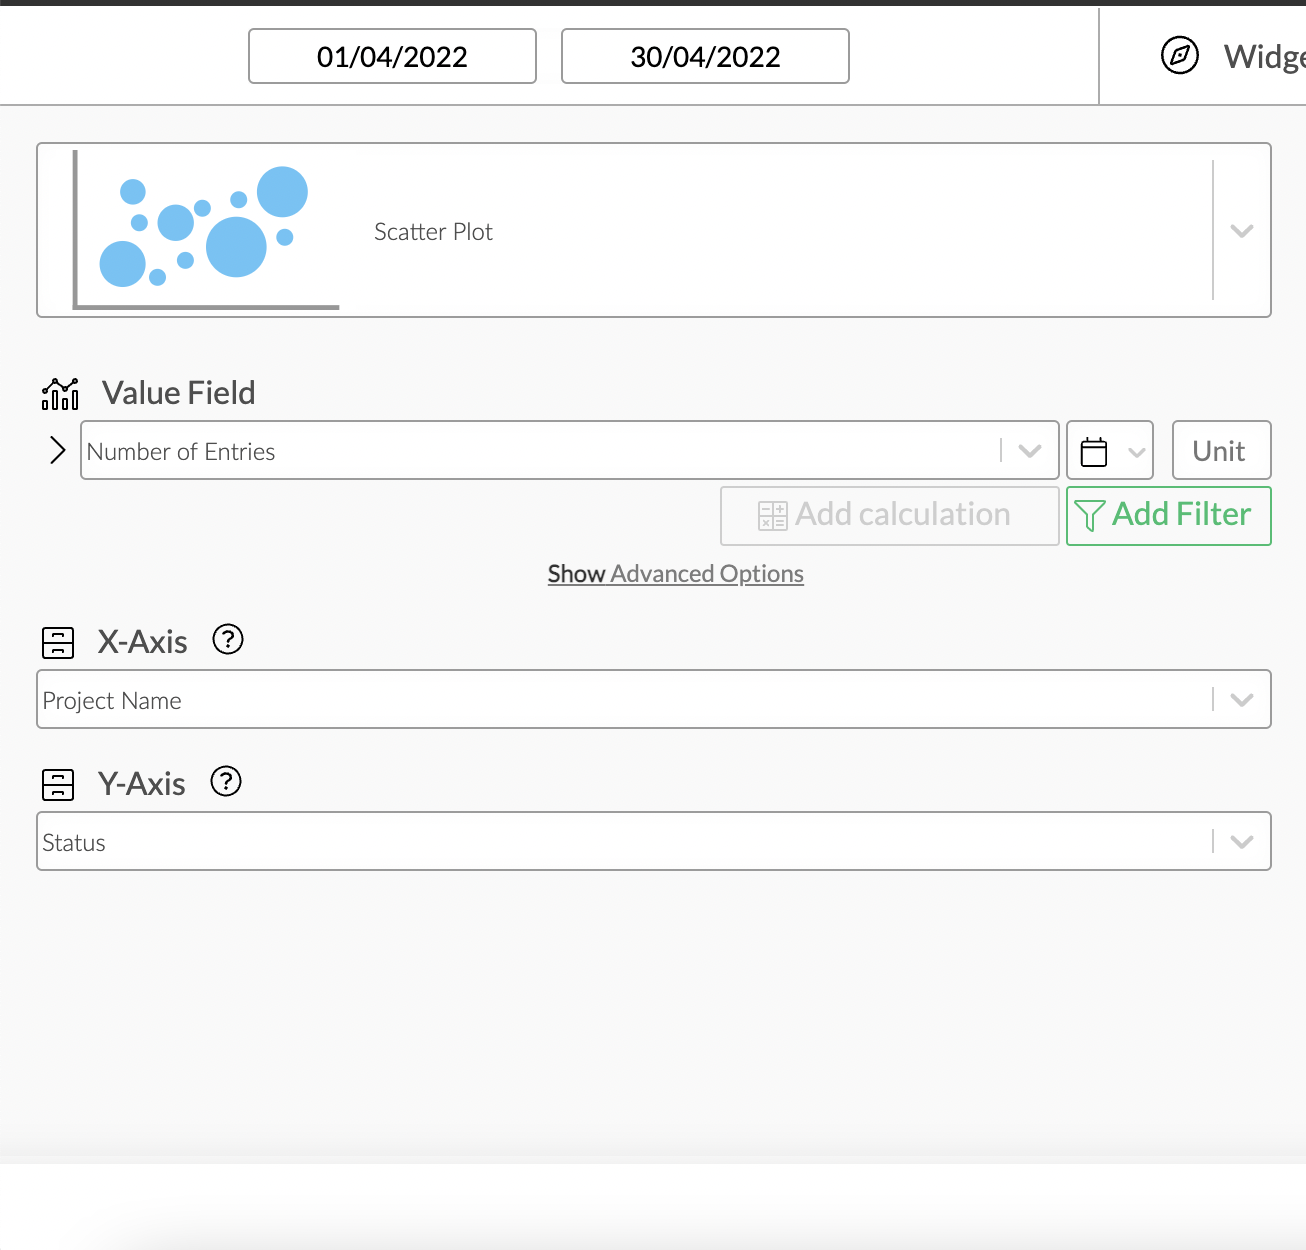
Scatter Plot Data Options Overview
Values
From top to bottom, the left side of a widget always starts with the value.
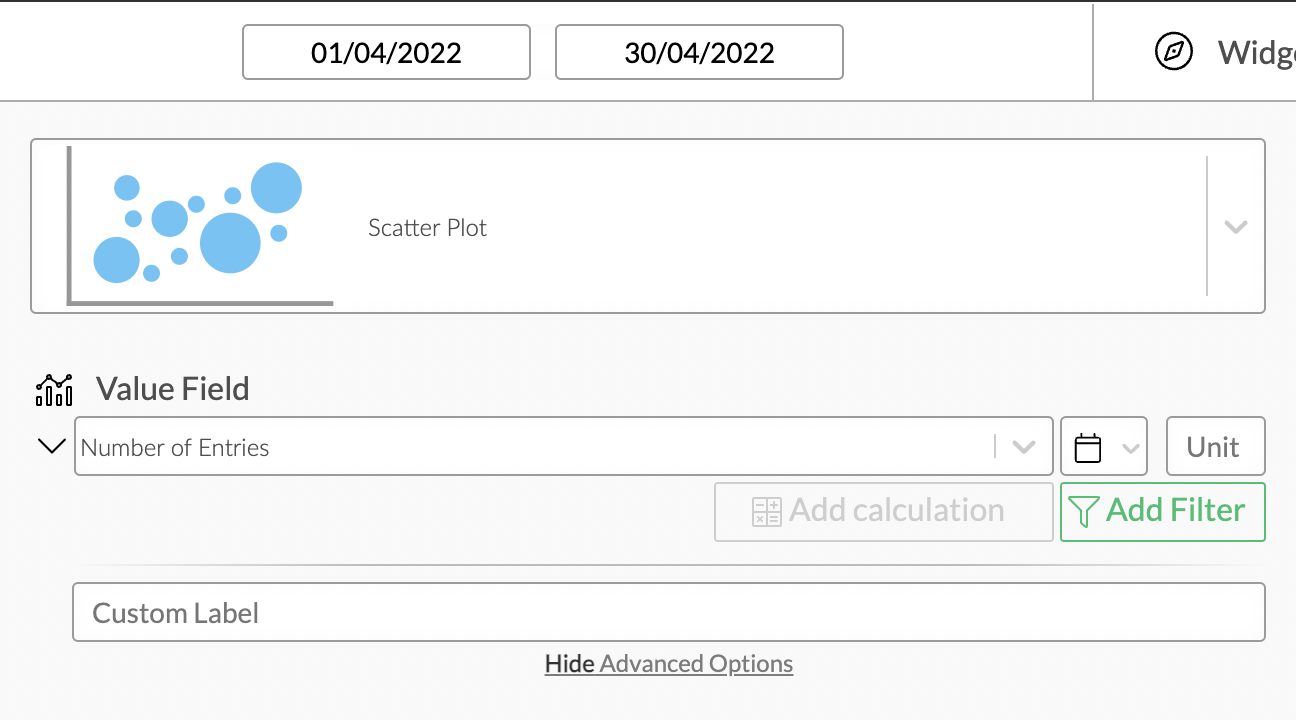
Scatter Plot Value Configuration
Value Filters
When configuring the value of the scatter plot, you can apply filters. You will find a more detailed tutorial on how to use them in the Filters section.
Display Options
Display options are used to modify the appearance of a widget. The following options are available:
You can limit the number of values on the two axes to focus your chart on the most important information.
In addition to that, you can choose how many decimals are displayed for each value.
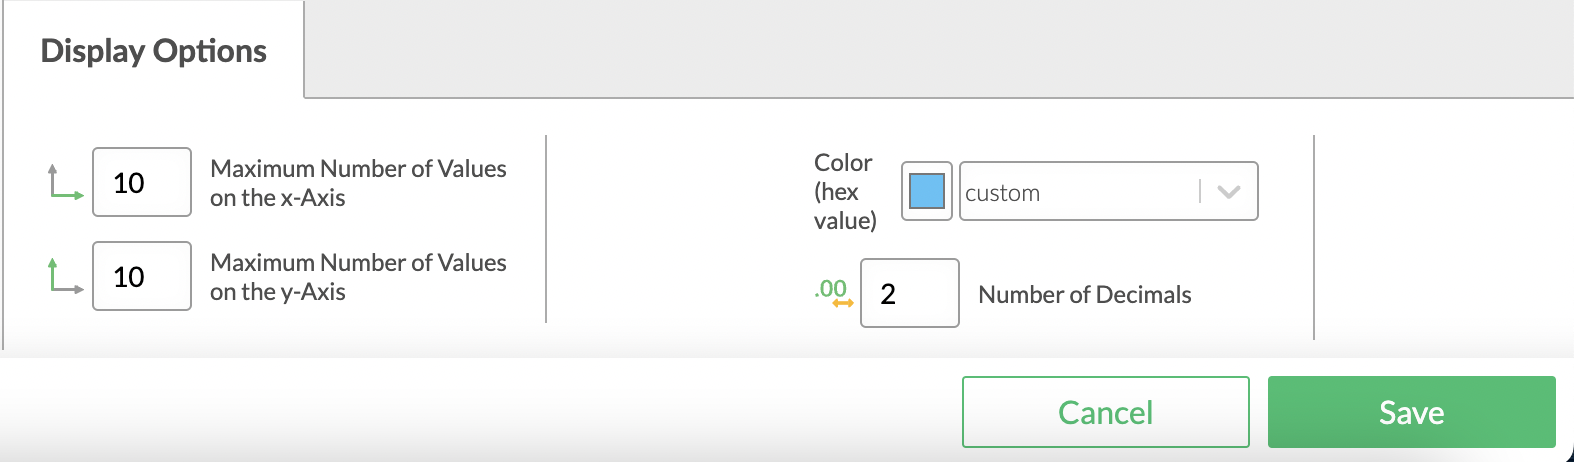
Scatter Plot Display Options