Sunburst Chart
Overview
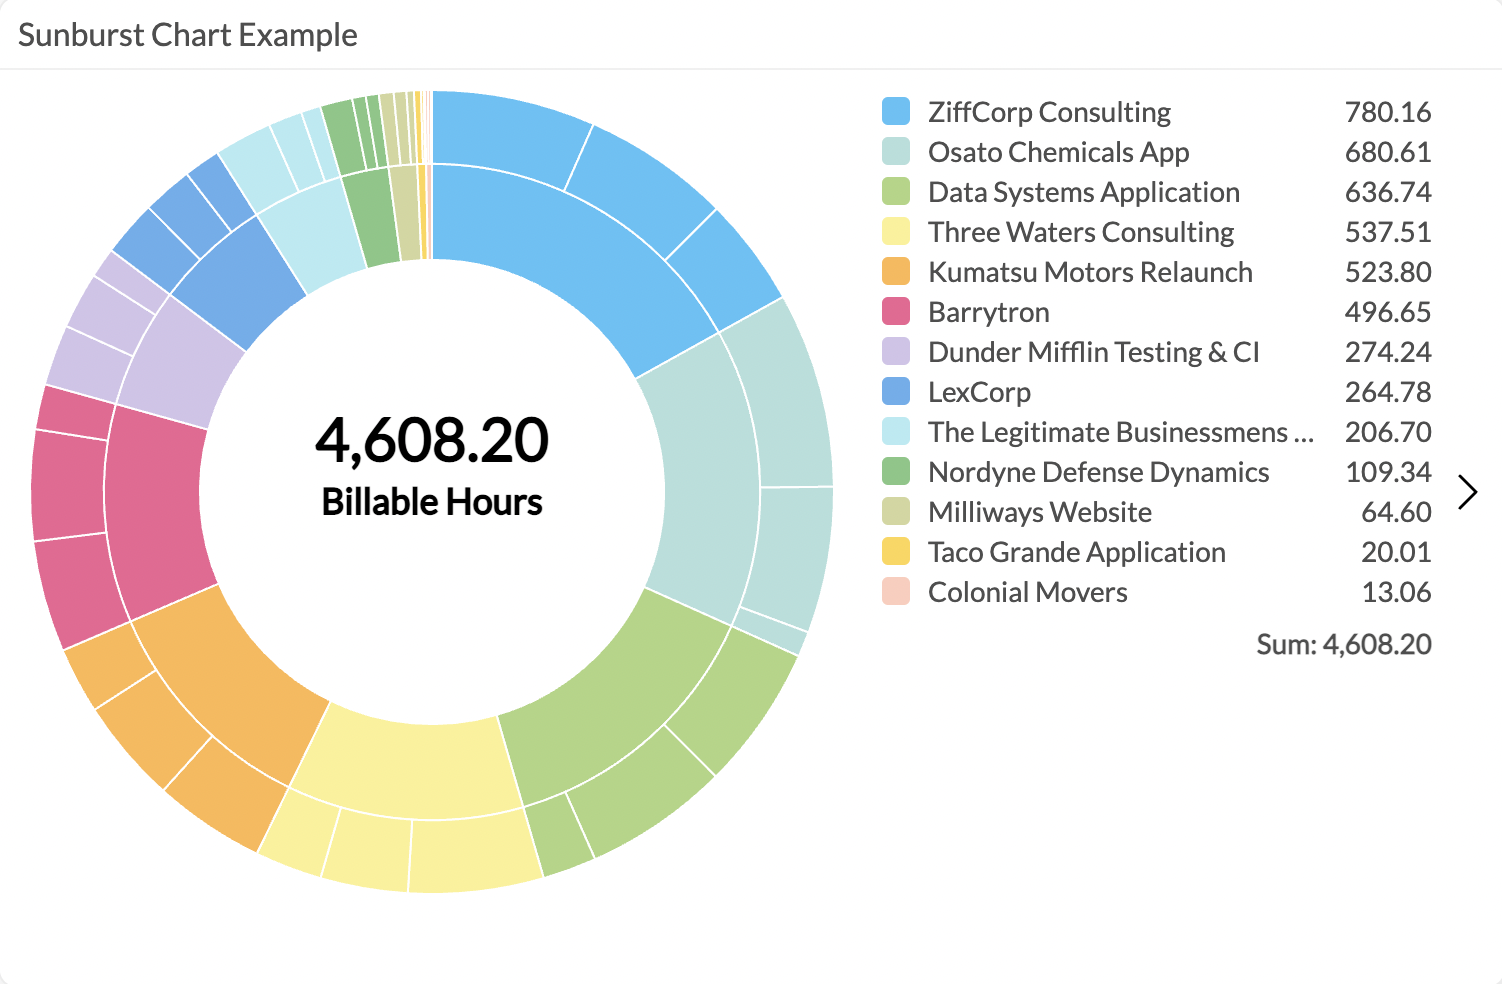
The Sunburst Chart is a very useful form of visualisation for data with one value and multiple pivot fields. You'll find more detailed information about the configuration of this chart below.
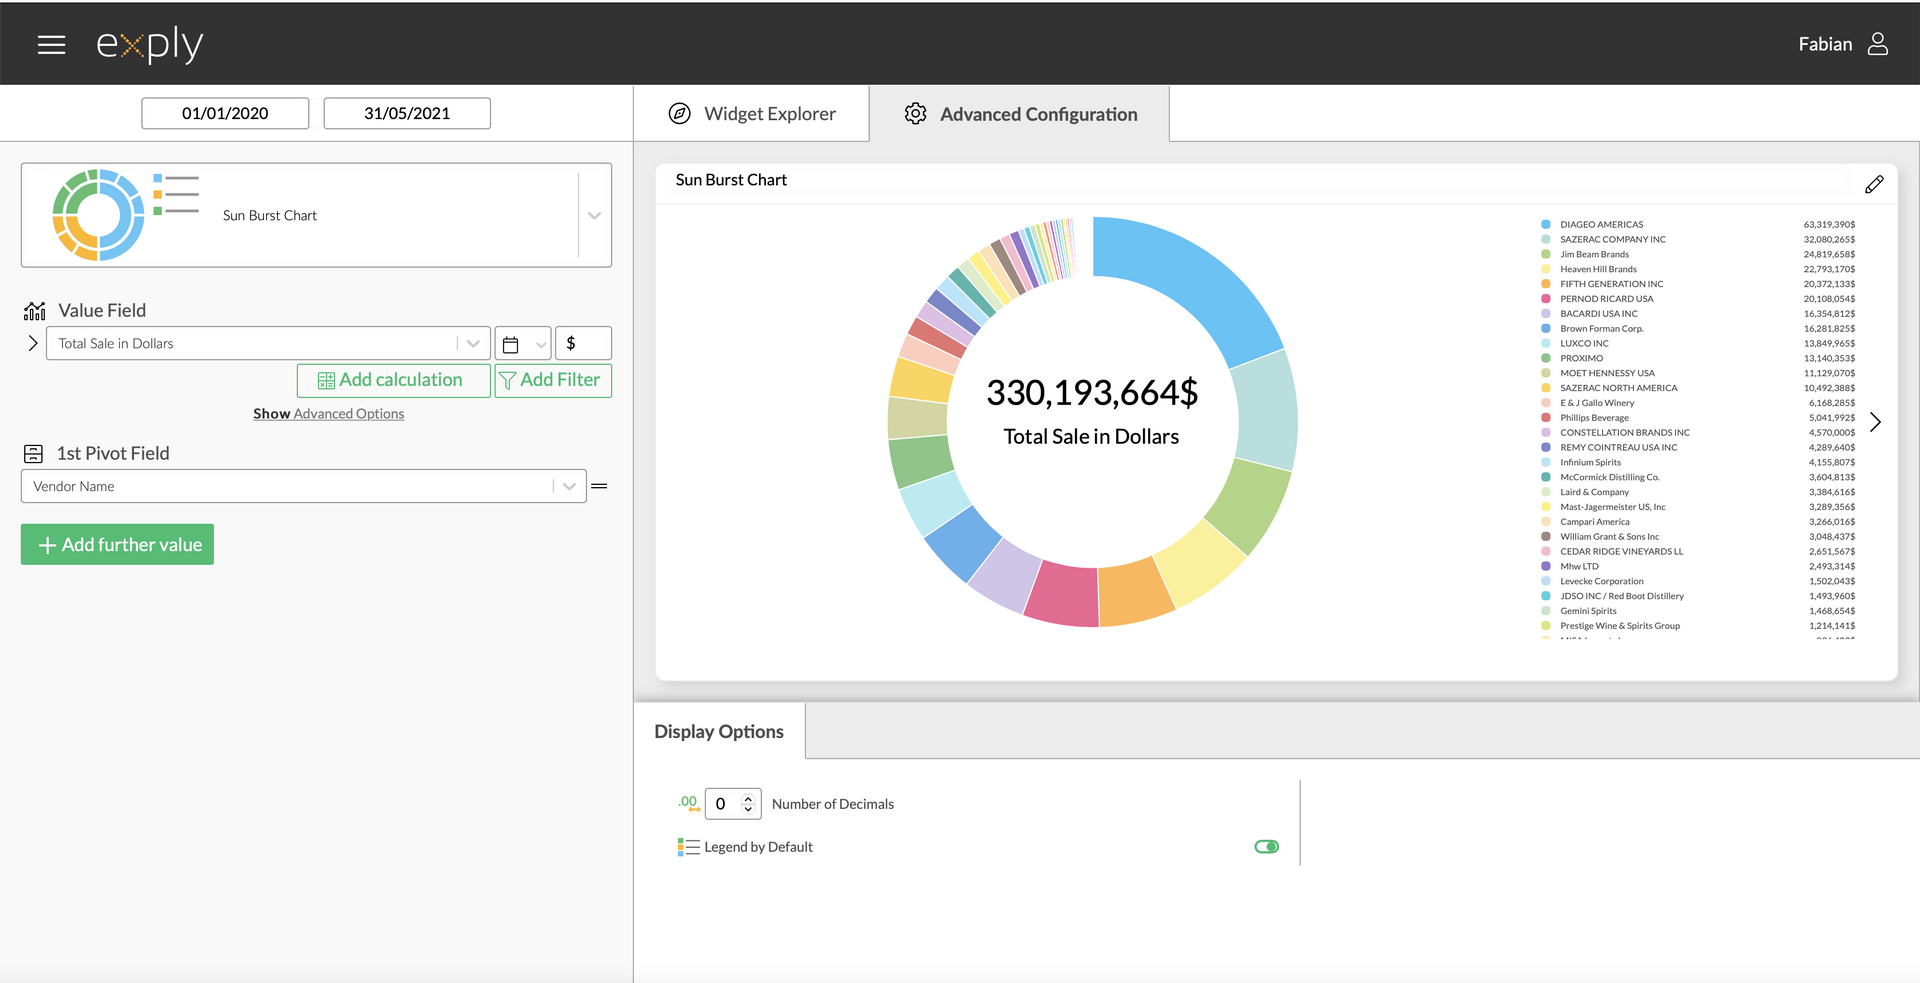
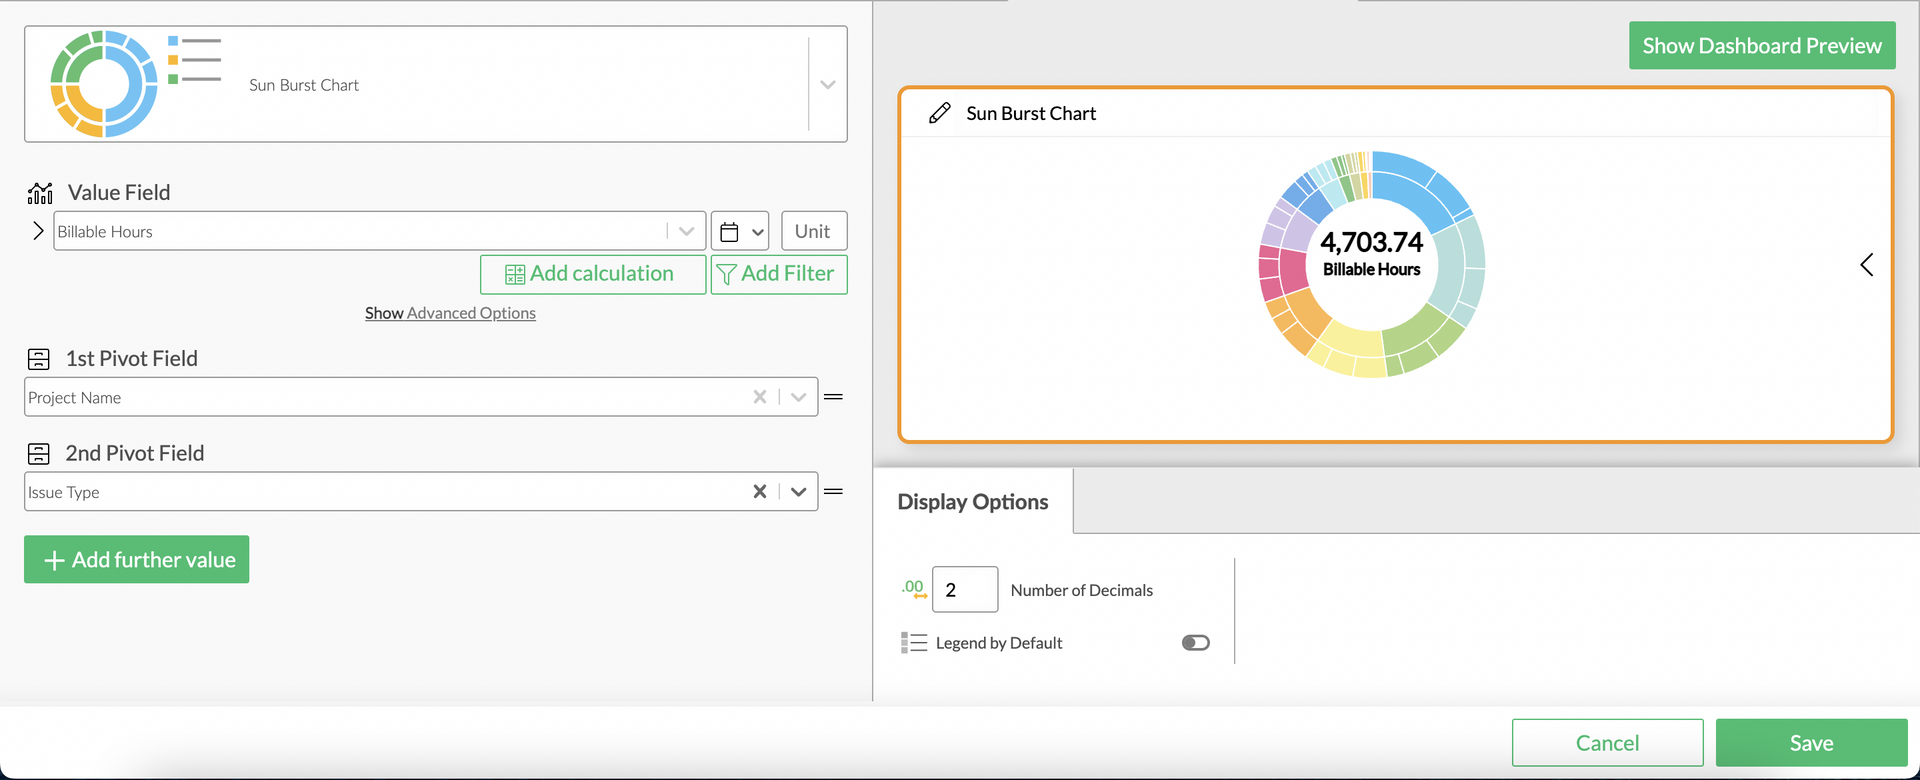
Sunburst Chart Advanced Configuration Screen
Options
Every widget comes with a different set of options. All available options are described in the following passage.
Data Options
The Sunburst Chart allows you to select a value which can be filtered or calculated (see Calculations section for more), as well as multiple pivot fields.
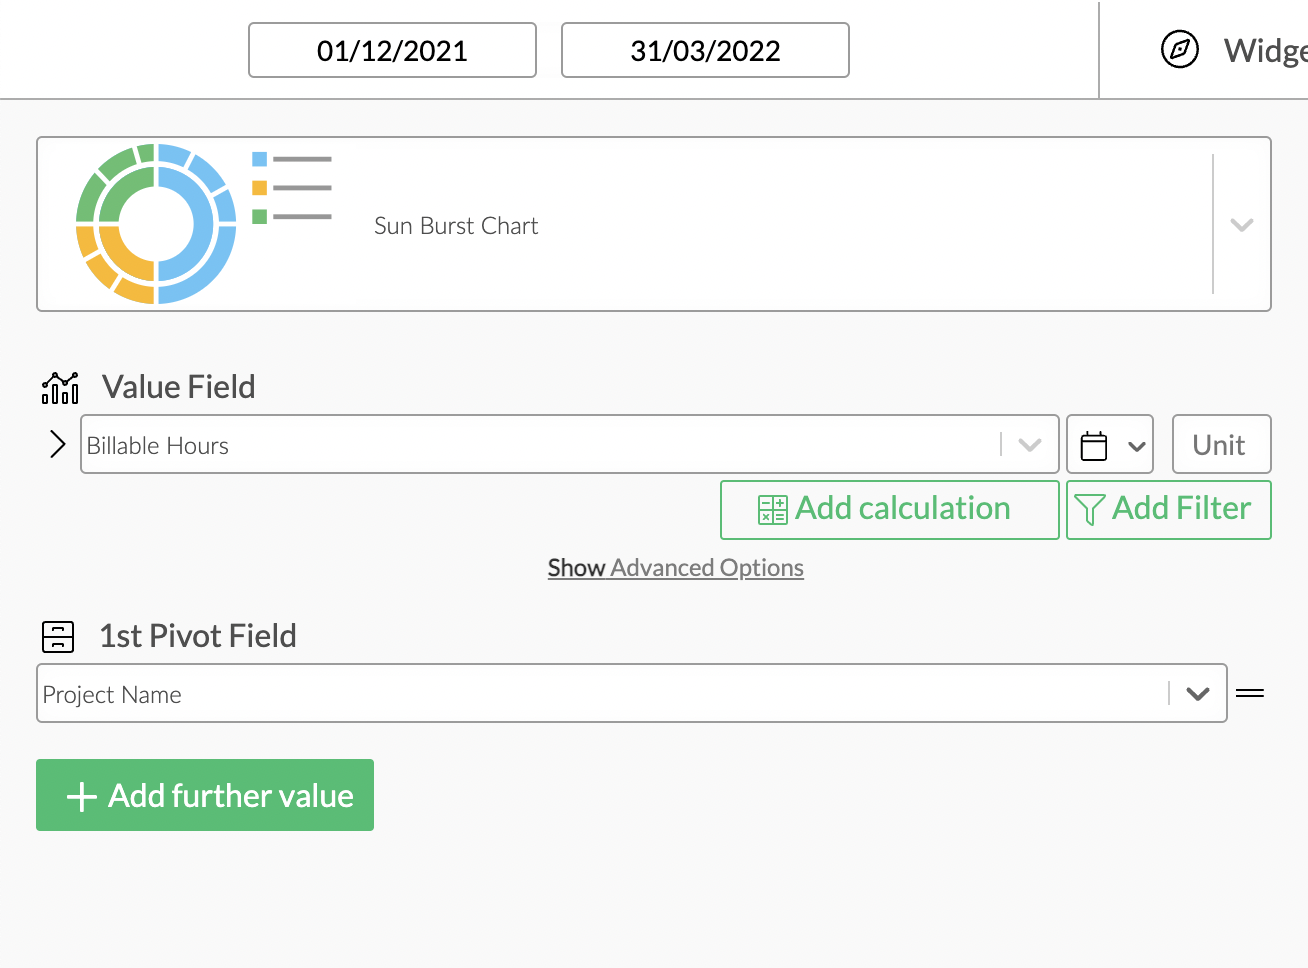
Sunburst Chart Data Options Overview
Values
From top to bottom, the left side of a widget always starts with the value.
After selecting the value, you can choose the corresponding date field or ignore the time selection (calendar icon to the right of the value field) and add a unit for a more user-friendly display.
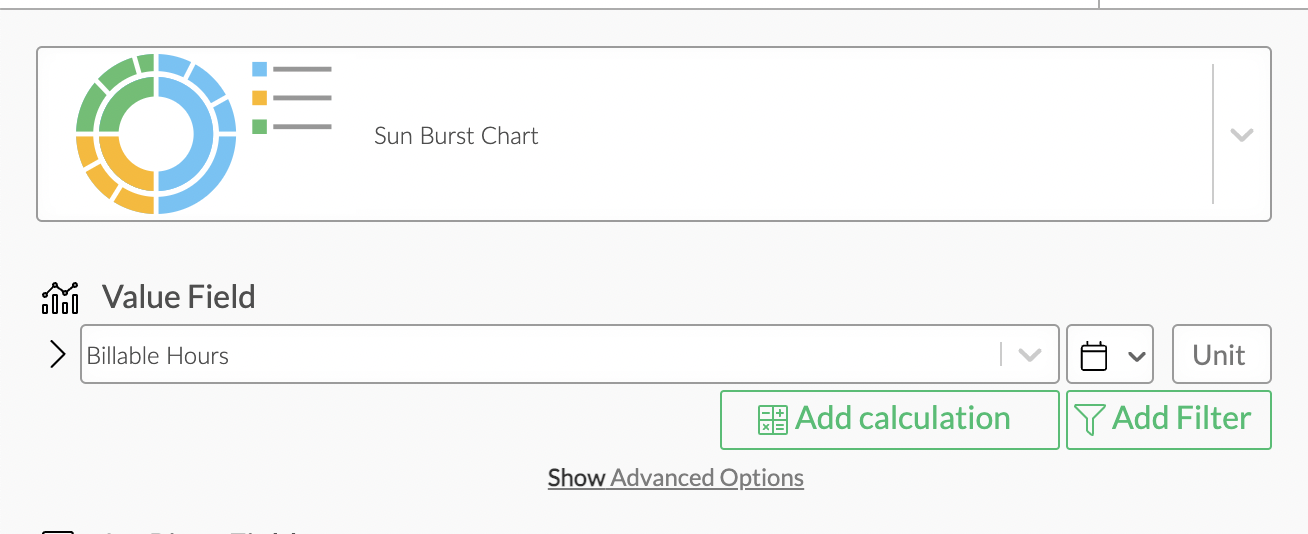
Sun Burst Chart Value Configuration
Value Filters
Value filters are available in all widgets. You will find a more detailed tutorial on how to use these in the Filters section.
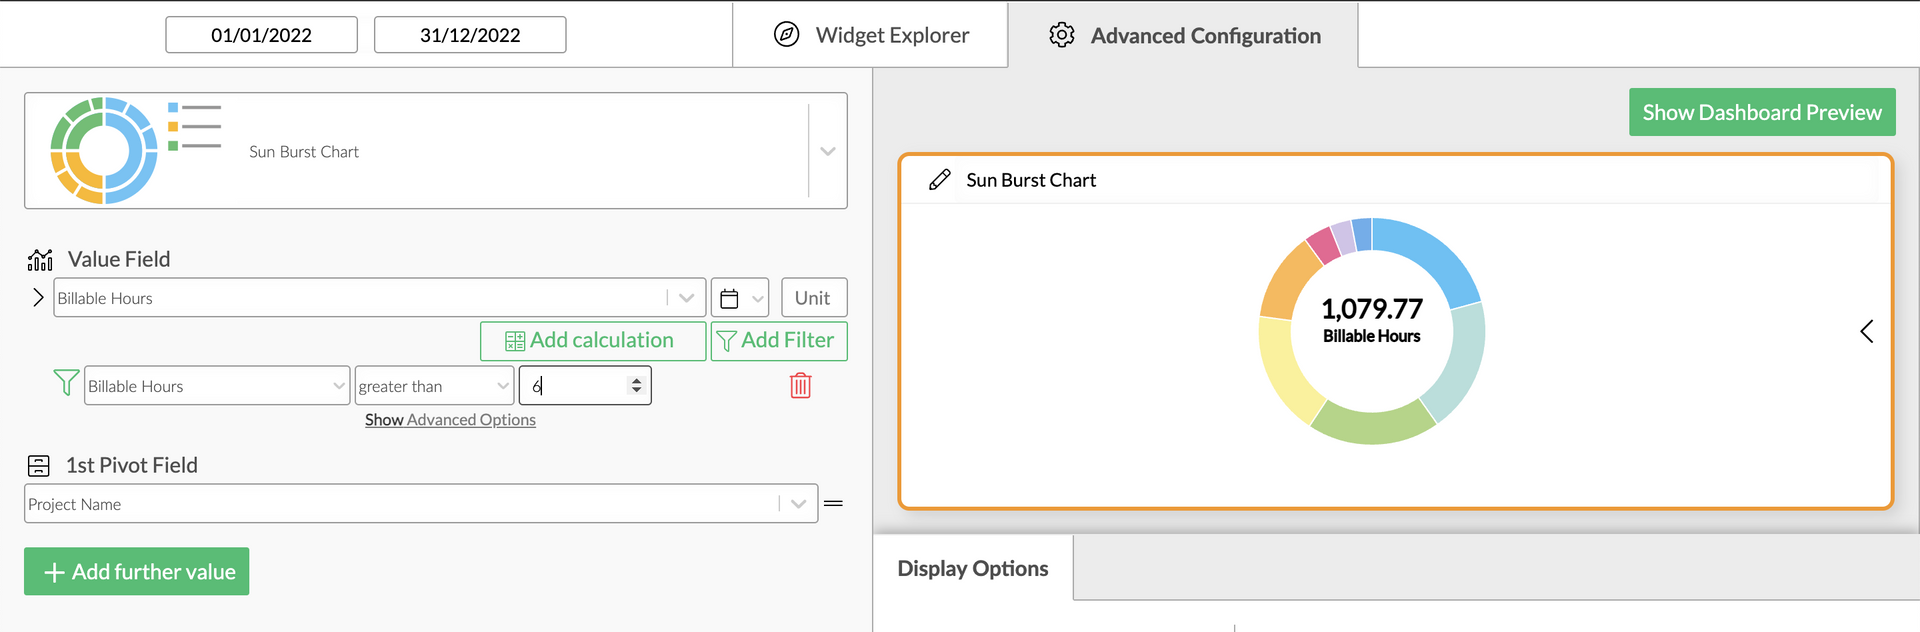
Value filter
Calculations
You can add calculations to your value fields. To find out more about how to implement them, check out the Calculations section.
Display Options
Display options are used to modify the appearance of a widget. The following options are available:
Number of Decimals
... defines the number of decimal places after the decimal point. Per default this is set to 2.
Legend by Default
When activated, a legend is permanently shown on the widget's right side. Per default the legend is deactivated.