Creating a Dashboard
New Dashboard
After you logged in to Exply you'll see the start screen with several options:
- Upload or Drag your data source file
- Connect your data source
- Create a Dashboard to analyse your data
To create a new dashboard just click the corresponding button in the top bar or beneath it on the welcome screen.
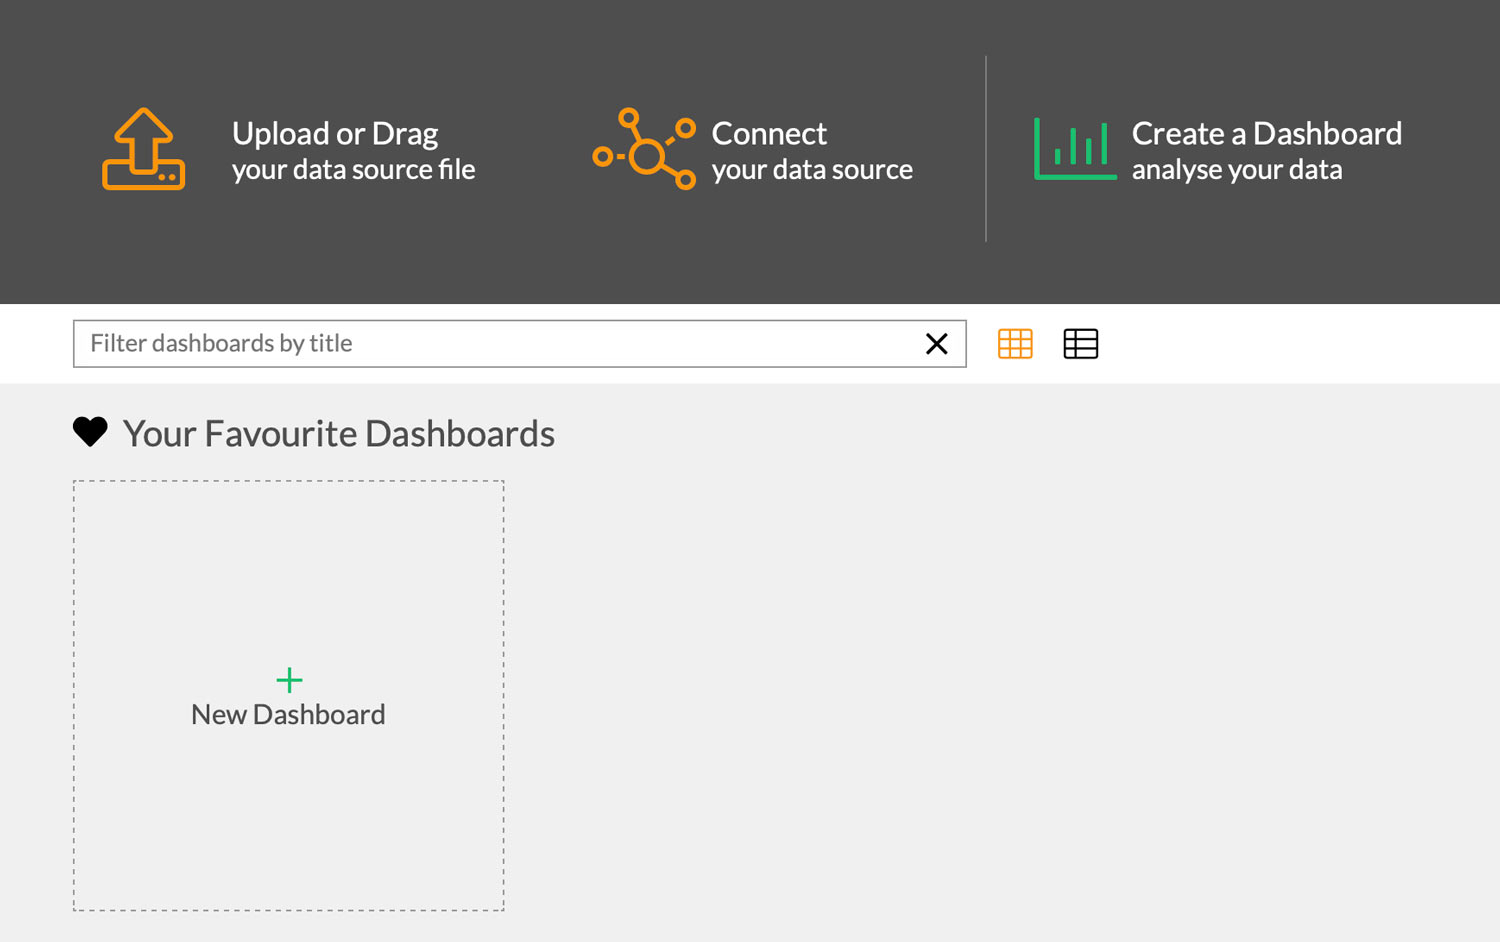
Create a new Dashboard from the Start Screen
Widget Explorer
After you've created a new Dashboard you'll see the Widget Explorer. It's the easiest way to find a basic visualization for your data. Just select your desired values and categories on the left side to instantaneously get some Widget examples. You don't need to know in advance which visualization form you want. Simply select the one you like most and add it to your Dashboard.
Depending on how many values and categories you select on the left side, the amount of available Widgets will change. Not every widget can visualize all select values.
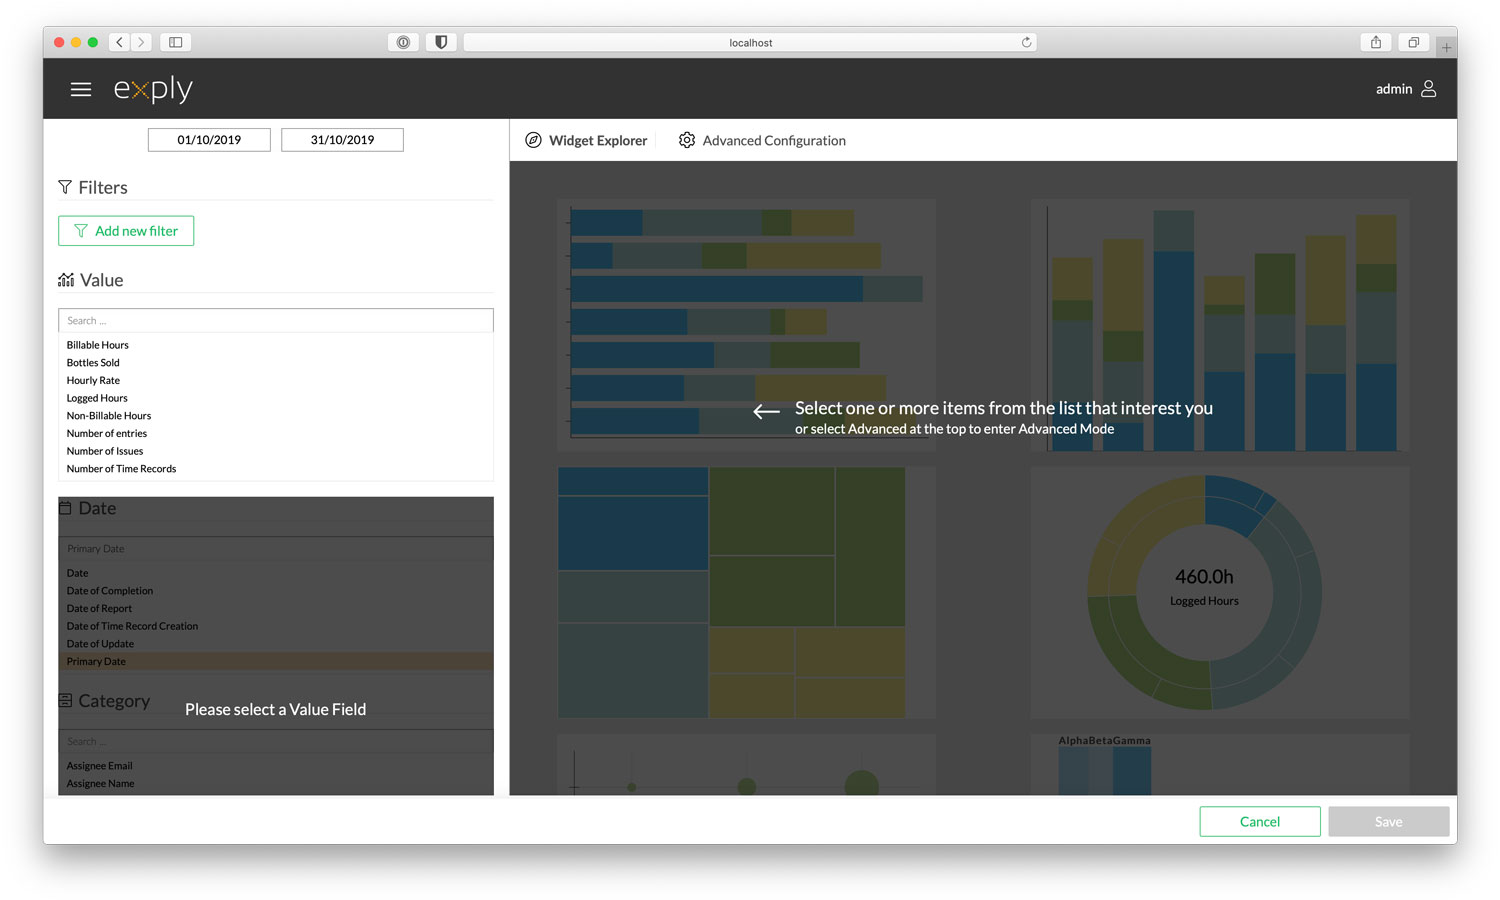
Select and filter the data you imported and Exply will provide you with some suggestions.
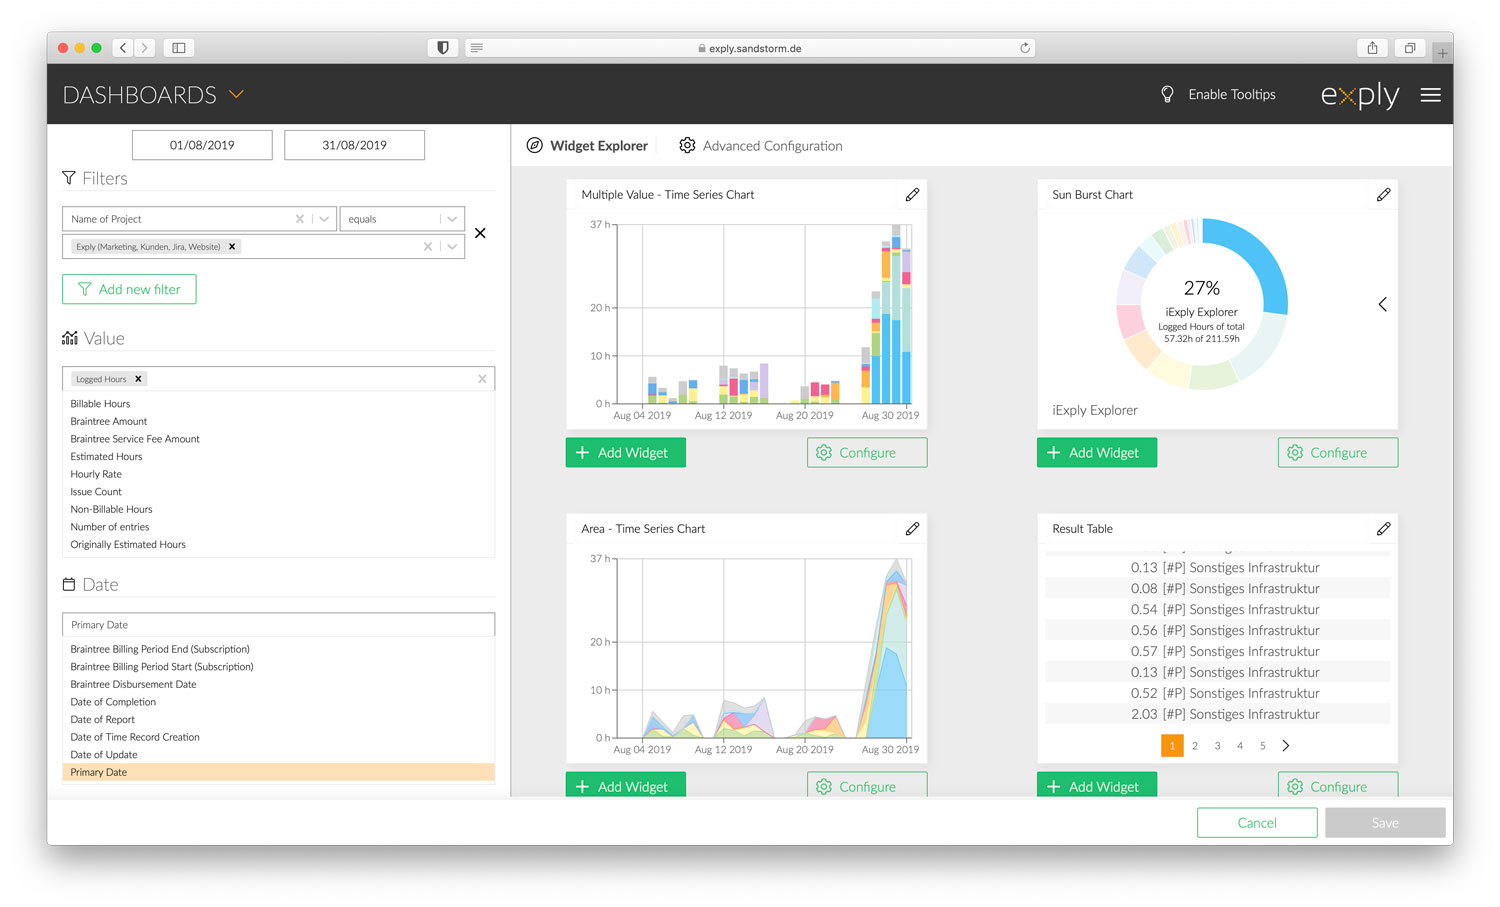
Advanced Configuration
Learn more about the advanced configuration in the "How do I create new Widgets?" section.
Data Filters
To learn more about filters, head over to the data filters tutorial.
Widgets
Feel free to continue reading in the Widgets section to learn more about what they are, which types exist and how to navigate them.